The Delta documentation has moved to https://docs.ncsa.illinois.edu/systems/delta/. Please update any bookmarks you may have.
Click in the link above if you are not automatically redirected in 5 seconds.
Click in the link above if you are not automatically redirected in 5 seconds.
You have ssh access to nodes in your running job(s) . A couple basic monitoring tools are demonstrated in the example transcript here. Screen shots are appended so that you can see the output from the tools. Most common linux utilities are available from the compute nodes (free, strace, ps ...).
[arnoldg@dt-login03 python]$ squeue -u $USER
JOBID PARTITION NAME USER ST TIME NODES NODELIST(REASON)
1214412 gpuA40x4- interact arnoldg R 8:14 1 gpub045
[arnoldg@dt-login03 python]$ ssh gpub045
gpub045.delta.internal.ncsa.edu (141.142.145.145)
OS: RedHat 8.4 HW: HPE CPU: 64x RAM: 252 GB
Last login: Wed Dec 14 09:45:26 2022 from 141.142.144.42
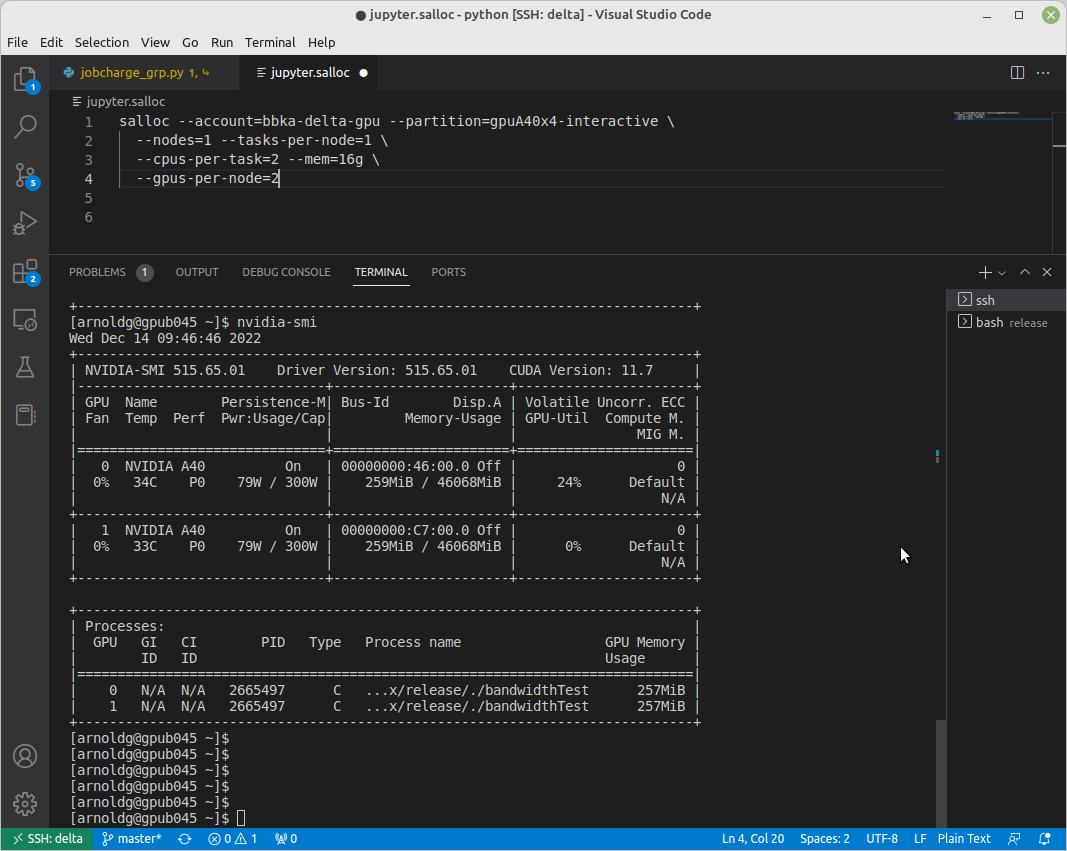
[arnoldg@gpub045 ~]$ nvidia-smi
[arnoldg@gpub045 ~]$ module load nvtop
----------------------------------------------------------------------------------------------------------
The following dependent module(s) are not currently loaded: cuda/11.6.1 (required by: ucx/1.11.2, openmpi/4.1.2)
----------------------------------------------------------------------------------------------------------
The following have been reloaded with a version change:
1) cuda/11.6.1 => cuda/11.7.0
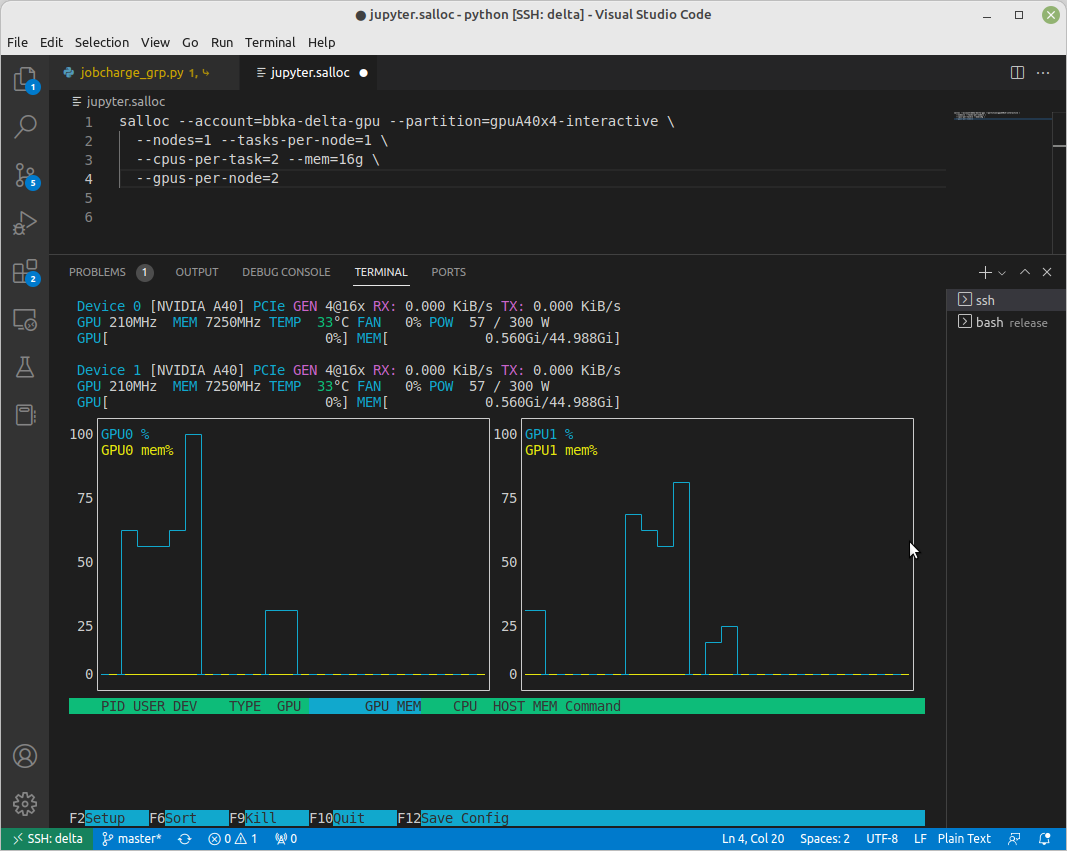
[arnoldg@gpub045 ~]$ nvtop
[arnoldg@gpub045 ~]$ module load anaconda3_gpu
[arnoldg@gpub045 ~]$ nvitop
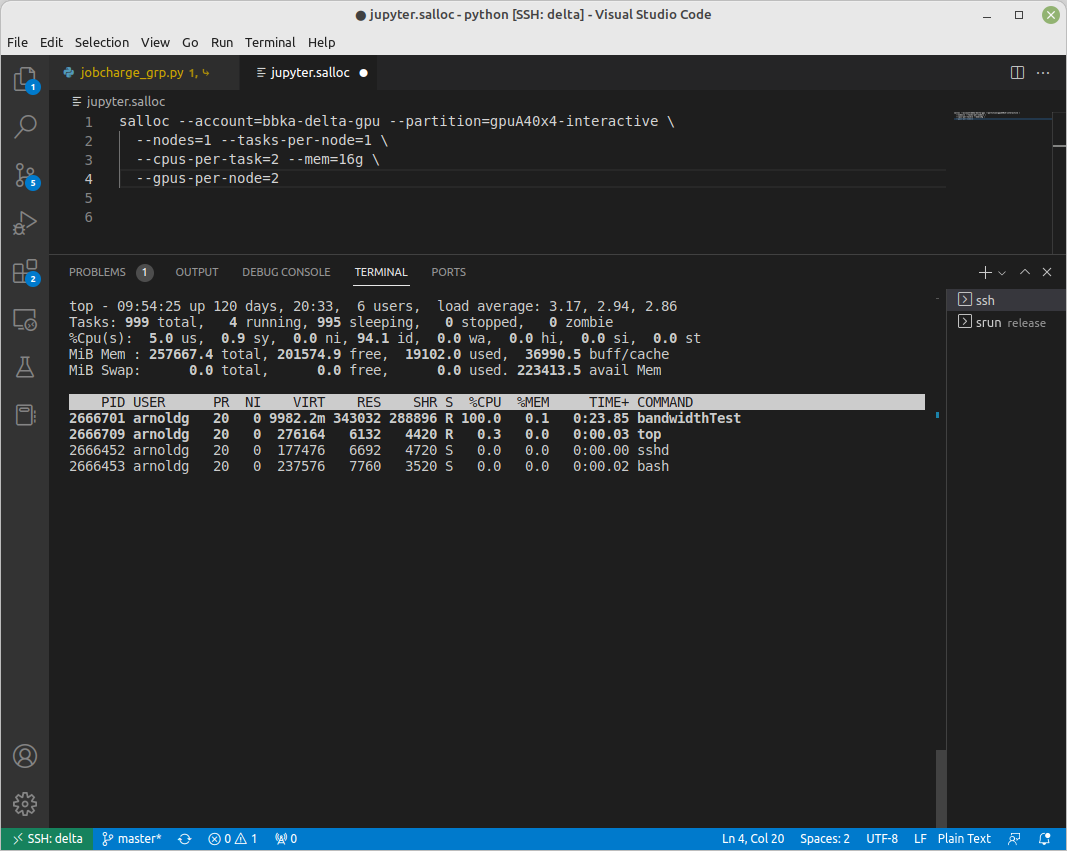
[arnoldg@gpub045 ~]$ top -u $USER
nvidia-smi :
nvtop :
nvitop :

top -u $USER :
1 Comment
Galen Arnold
TODO:
Add grafana back end examples when available. https://metrics.ncsa.illinois.edu
Make sure to sign in at the lower left of the initial page:
Then navigate to the part of Delta metrics of interest.
You may choose a node from the list of nodes and get detail information in real time.