The Shallow demo project from the eclipse tutorial cvs can be used with gprof and gcov with a few simple adjustments to the Makefile and MPI runtime. Here are the details and some discussion of what can be done with the profiling and coverage output.
First, the source code is from the demo project and the checkout is described here:
https://wiki.ncsa.illinois.edu/download/attachments/20619123/ptp-03-dev.ppt
Once checked out, fix the bug in the for() loop of main.c and build the project (Copy Makefile.mk to Makefile and adjust as needed). Then setup a run configuration with openmpi on your favorite system. I've chosen my own laptop but you could also setup a synchronized project and use a remote system of your choice. My laptop runs Ubuntu, the GNU compilers, and OpenMPI which makes working with Eclipse and developing test/demo codes a snap.
To use gprof and gcov, add the appropriate flags to the Makefile. I'll run a single test job to get both profile and coverage data at once by using -pg for gprof and "-ftest-coverage -fprofile-arcs" for gcov (-g is included so that we have source code line numbering available): 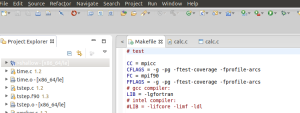
Setup the MPI run configuration with the Environment variable GMON_OUT_PREFIX defined with a name for your individual MPI rank gmon outputs. By default gmon.out is used but MPI doesn't do that well and you end up with a profile that's missing most of the information, so by using GMON_OUT_PREFIX, each MPI rank adds its process id to its gmon output filename.
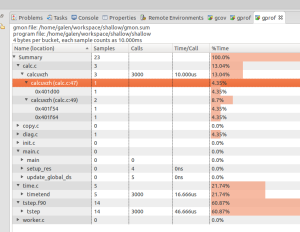
The gmon output files can be combined in a summary with the gprof -s command as shown. It's interesting to compare the summary gmon output to that from one of the ranks (copy a rank's gmon_* to gmon.out to easily view it with Eclipse linuxtools ).
galen@lgheron:~/workspace/shallow$ gprof -s shallow gmon_*
galen@lgheron:~/workspace/shallow$ ls
calc.c     decs.h     eclipse.inc        init.o        time.c      worker.c
calc.gcda  diag.c     gmon_shallow.9885  main.c        time.gcda   worker.gcda
calc.gcno  diag.gcda  gmon_shallow.9886  main.gcda     time.gcno   worker.gcno
calc.o     diag.gcno  gmon_shallow.9887  main.gcno     time.o      worker.o
copy.c     diag.o     gmon_shallow.9888  main.o        tstep.c
copy.gcda  dump.c     gmon.sum           Makefile      tstep.f90
copy.gcno  dump.gcda  init.c             Makefile.gem  tstep.gcda
copy.o     dump.gcno  init.gcda          Makefile.mk   tstep.gcno
CVS        dump.o     init.gcno          shallow       tstep.o
galen@lgheron:~/workspace/shallow$
![]()
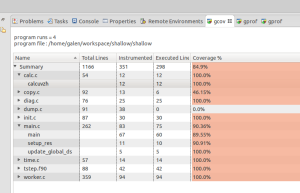
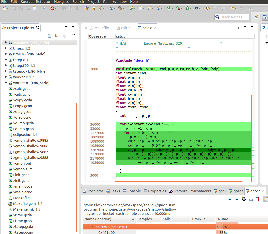
The gcov view is simlar to the gprof view but keep in mind that you're looking at code coverage and not necessarily performance or timing information (though there is a relationship...code not executed is performing quite well ! ). Also note that multiple executions will accumulate values in the gmon output files until they are removed or truncated to zero-length.
Selecting (double click) a source code line from either the gcov or gprof view and you'll see the file and routine highlighted in the cdt c/c++ perspective. 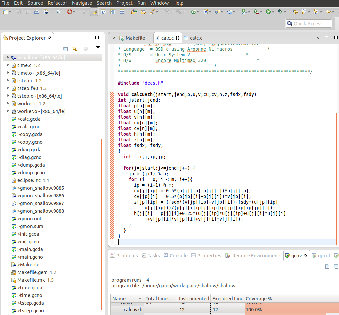
References:
http://wiki.eclipse.org/Linux_Tools_Project/GProf/User_Guide
http://www.ncsa.illinois.edu/UserInfo/Resources/Hardware/SGIAltix/Doc/timing.html
http://archive.ncsa.illinois.edu/lists/perftools/may02/msg00001.html