Contributors:
Seid Koric
Greg Bauer
Rick Kufrin
Rui Liu
Susan John
Galen Arnold
Cpusets and integration with PBS
cpuset information
The following commands will display the active cpuset information for use by the current shell. Notice that batch jobs are allocated in whole-processors (6 cores). These commands work for both the login and batch environments.
arnoldg@ember:~> cat ~/bin/mycpuset
cat /proc/self/cpuset
grep _allowed_list /proc/self/status

# interactive example
arnoldg@ember:~> ~/bin/mycpuset
/user
Cpus_allowed_list:	12-23
Mems_allowed_list:	2-3
arnoldg@ember:~>

# BATCH example
arnoldg@ember-cmp4:~> ~/bin/mycpuset
/PBSPro/47614.ember
Cpus_allowed_list:	318-323,330-335
Mems_allowed_list:	53,55
MPI_ environment variable settings
MPI_BUFFER_MAX
Setting this variable can have a large effect on performance depending on message size. For example, setting this to a small value greatly boosts ping_pong performance :
export MPI_BUFFER_MAX=1000
export MPI_SHARED_NEIGHBORHOOD=MEMNODE
mpirun -np 2 taskset -c 12,348 ping_pong
...
  least squares fit:  time = a + b * (msg length)
     a = latency =     7.14 microseconds
     b = inverse bandwidth =  0.00041 secs/Mbyte
     1/b = bandwidth =  2419.32 Mbytes/sec

     message         observed          fitted
  length(bytes)     time(usec)       time(usec)

      1000.             8.07             7.55
      2000.             7.96             7.96
      3000.             8.18             8.38
      4000.             8.68             8.79
      5000.             9.21             9.20
      6000.             9.47             9.62
      7000.             9.81            10.03
      8000.            10.29            10.44
      9000.            10.74            10.86
     10000.            11.11            11.27

mpirun -np 2 taskset -c 12,13 ping_pong
...
  least squares fit:  time = a + b * (msg length)
     a = latency =     0.52 microseconds
     b = inverse bandwidth =  0.00014 secs/Mbyte
     1/b = bandwidth =  7121.50 Mbytes/sec

     message         observed          fitted
  length(bytes)     time(usec)       time(usec)

      1000.             0.78             0.66
      2000.             0.87             0.80
      3000.             0.96             0.94
      4000.             1.09             1.08
      5000.             1.28             1.22
      6000.             1.39             1.36
      7000.             1.51             1.50
      8000.             1.61             1.64
      9000.             1.78             1.78
     10000.             2.01             1.92
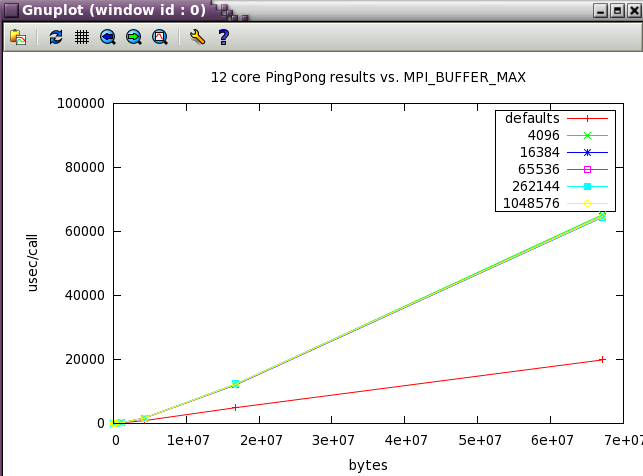
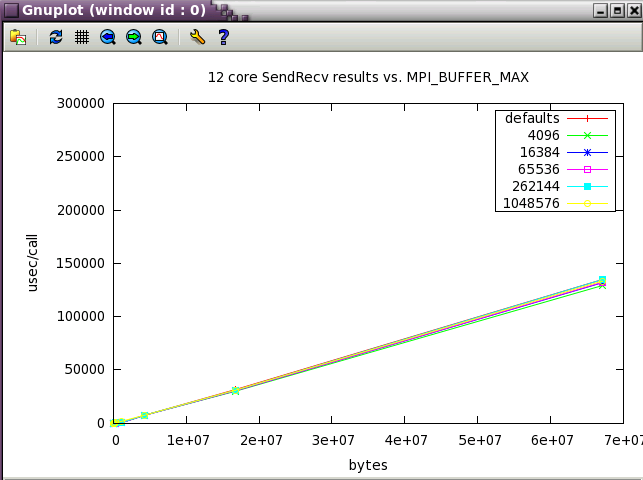
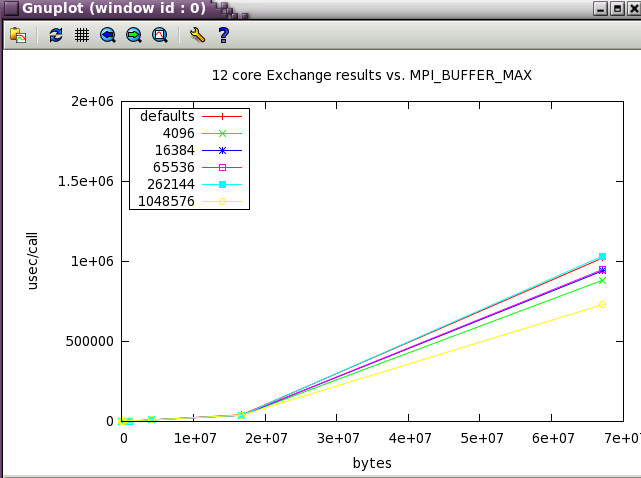
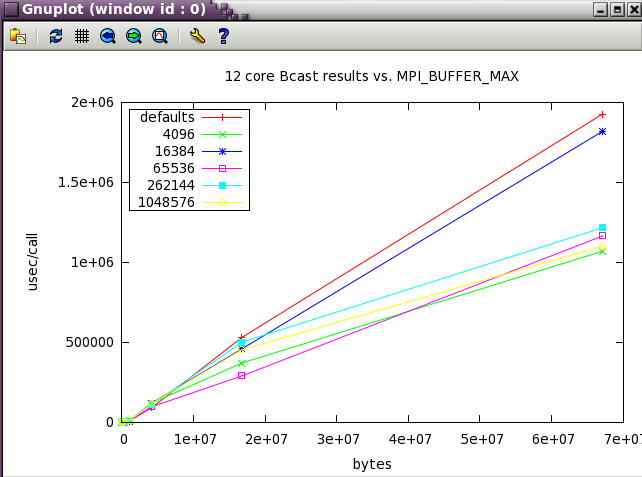
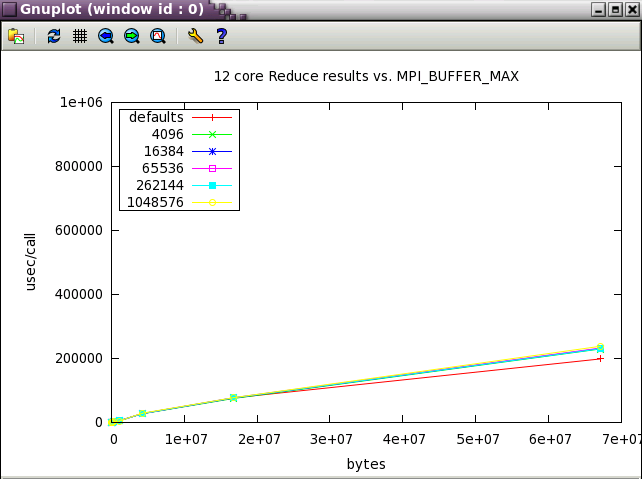
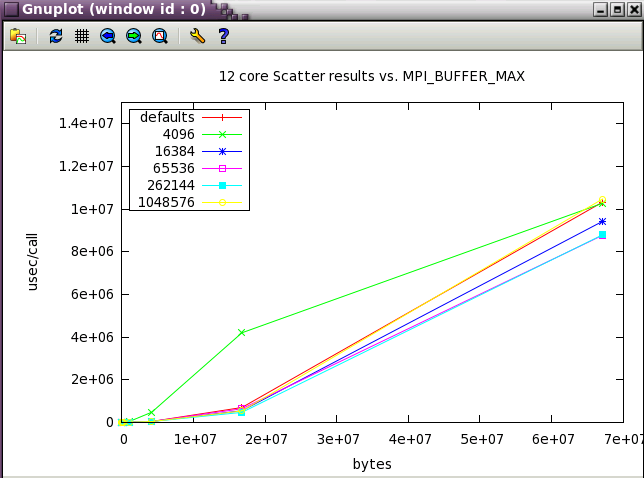
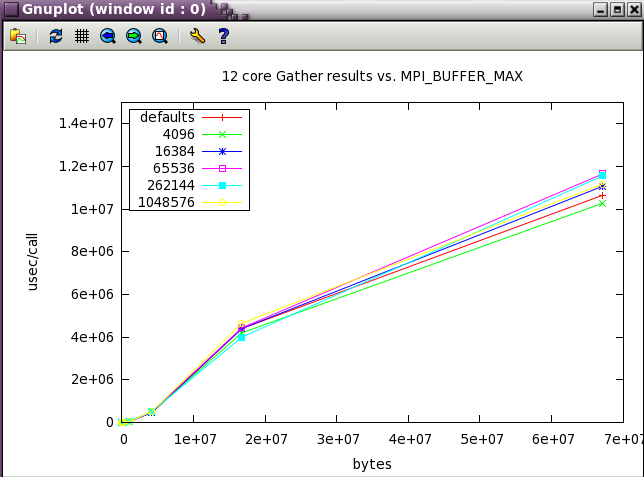
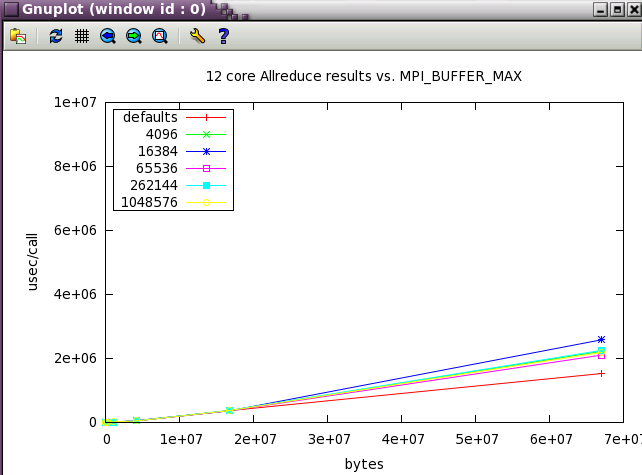
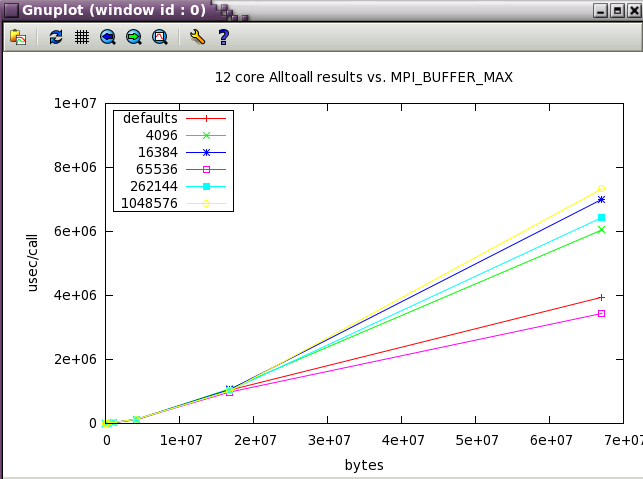
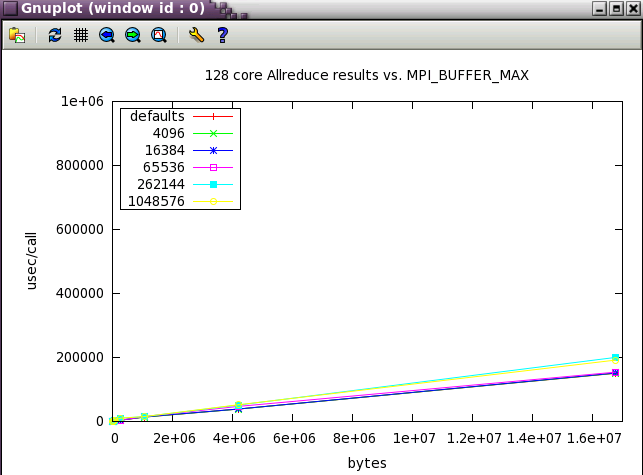
MPI_BUFFER_MAX parameter sweep with IMB benchmark
A variety of message sizes from 4k through 64MB were tested with various settings of MPI_BUFFER_MAX. The following table and gnuplots present the data from the benchmarks. Here's a typical output stanza from IMB and a small 12 core test. As test size scaled up, the max test message size was reduce to 16MB.
#---------------------------------------------------
# Benchmarking PingPong
# #processes = 2
# ( 10 additional processes waiting in MPI_Barrier)
#---------------------------------------------------
       #bytes #repetitions      t[usec]   Mbytes/sec
         4096         1000         1.41      2770.67
        16384         1000         3.90      4010.95
        65536          640        11.49      5437.97
       262144          160        43.03      5809.79
      1048576           40       153.41      6518.47
      4194304           10       828.21      4829.68
     16777216            2      4887.61      3273.58
     67108864            1     19795.56      3233.05
The first set in the study was run with 12 core (2 NUMA nodes on ember).
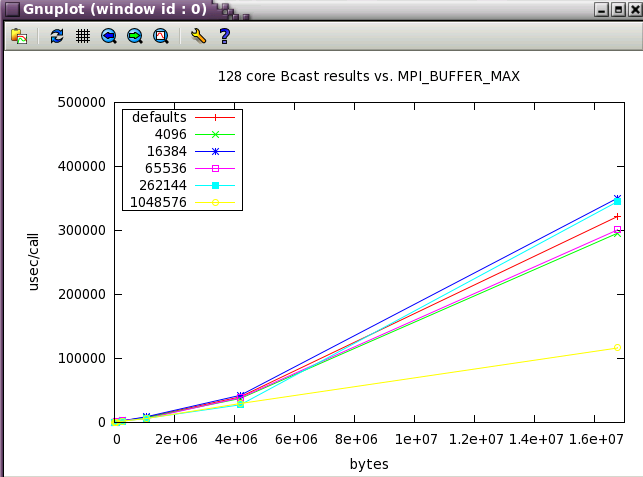
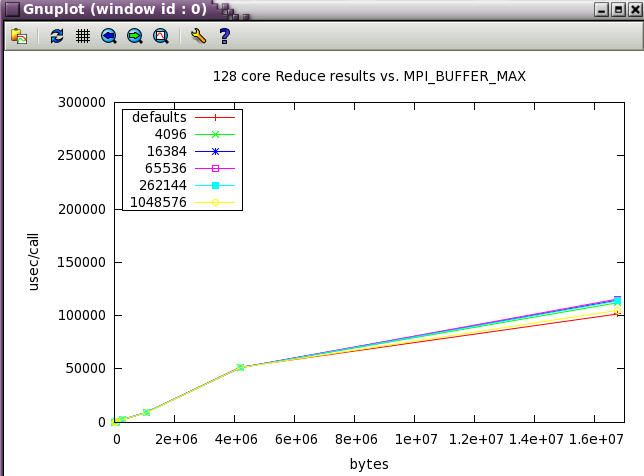
Next, a subset of the tests above were run a wider scale of 128 cores (22 NUMA nodes). 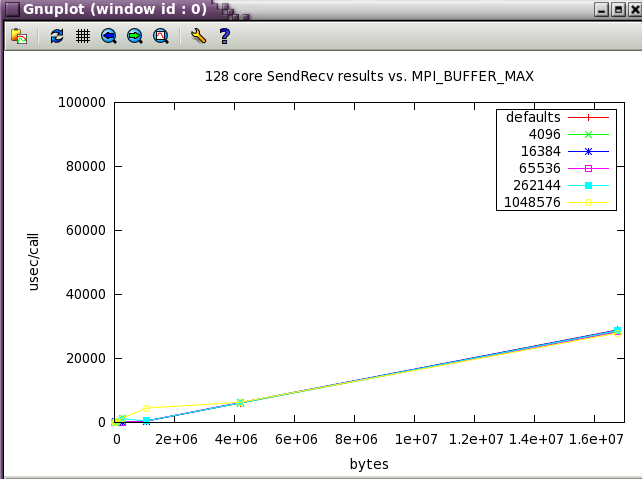
MPI_MAPPED_HEAP_SIZE
For large scale apps, setting this to -1 or 0 (disabling it) or a reasonable value like 2G ( 2000000000 ) may be necessary .
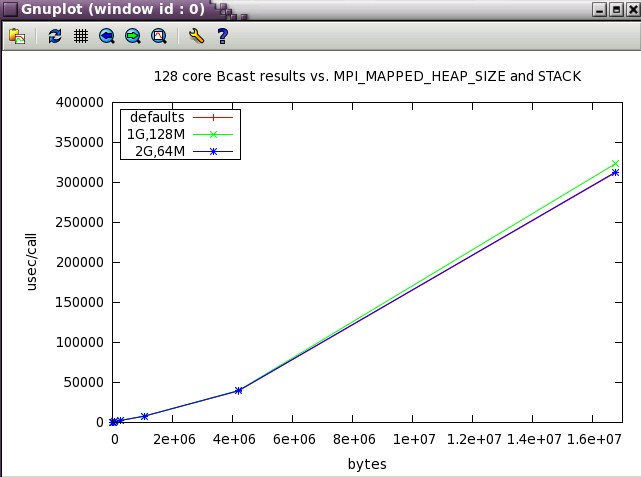
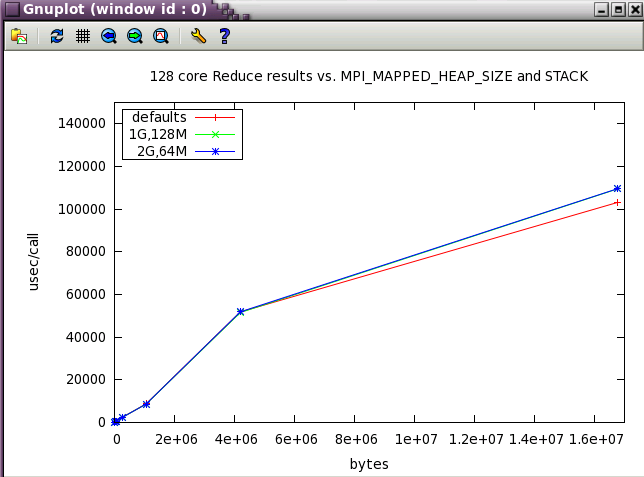
MPI_MAPPED_HEAP_SIZE parameter sweep with IMB benchmark
The same subset of tests from above was run with 128 cores while varying MPI_MAPPED_HEAP_SIZE and MPI_MAPPED_STACK_SIZE from their defaults.
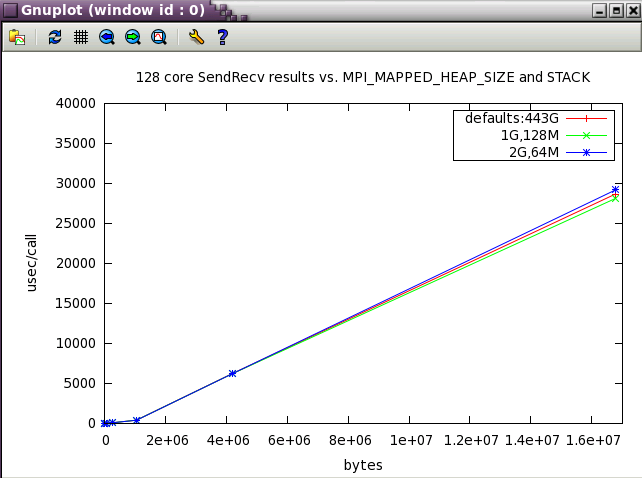
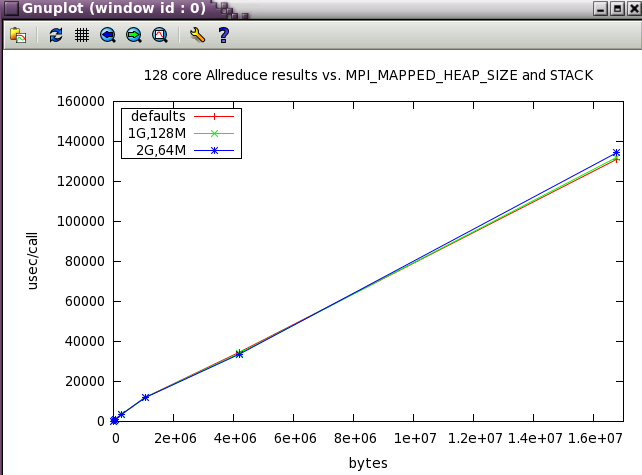
MPI_MAPPED_STACK_SIZE
Set to the shell limit, typically : 131072000
MPI_SHARED_NEIGHBORHOOD
For HPL, setting MPI_SHARED_NEIGHBORHOOD=HOST provides the best performance, but for other codes, that may not be the preferred setting. The ping_pong code gives better performance with settings of BLADE or MEMNODE:
export MPI_SHARED_NEIGHBORHOOD=MEMNODE
mpirun -np 2 taskset -c 12,348 ping_pong
...
  least squares fit:  time = a + b * (msg length)
     a = latency =     7.49 microseconds
     b = inverse bandwidth =  0.00069 secs/Mbyte
     1/b = bandwidth =  1446.81 Mbytes/sec

     message         observed          fitted
  length(bytes)     time(usec)       time(usec)

      1000.             8.01             8.18
      2000.             8.84             8.87
      3000.             9.37             9.57
      4000.            10.02            10.26
      5000.            10.86            10.95
      6000.            11.64            11.64
      7000.            12.36            12.33
      8000.            12.83            13.02
      9000.            13.72            13.71
     10000.            14.53            14.40
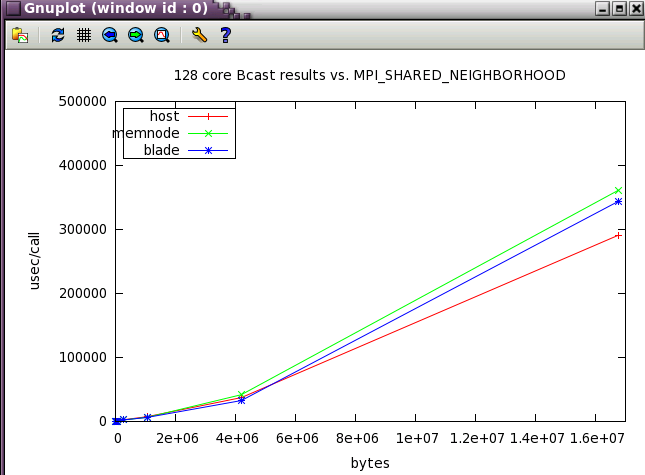
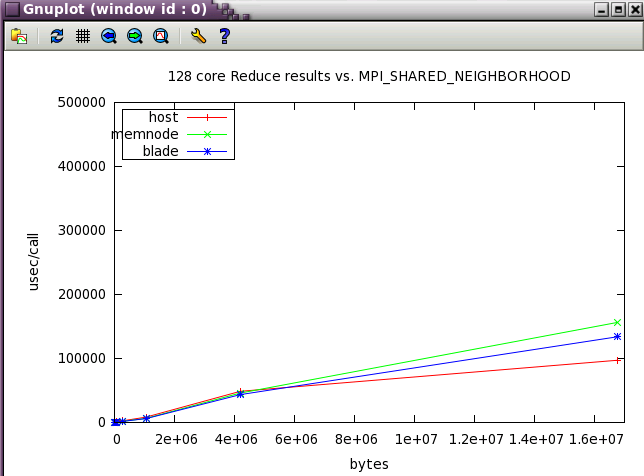
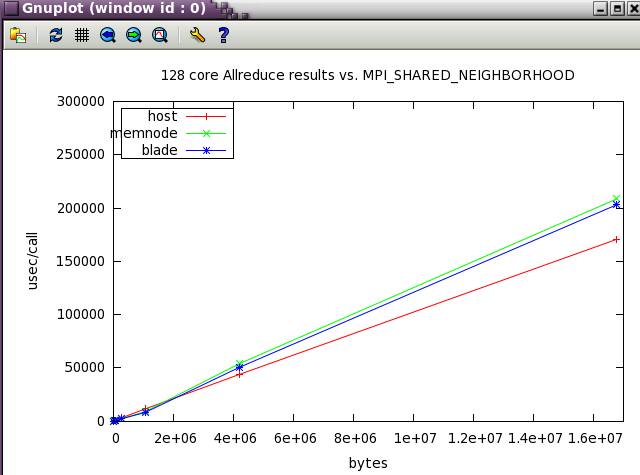
MPI_SHARED_NEIGHBORHOOD parameter sweep with IMB benchmark
The same IMB 128 core tests from above were run while varying MPI_SHARED_NEIGHBORHOOD. 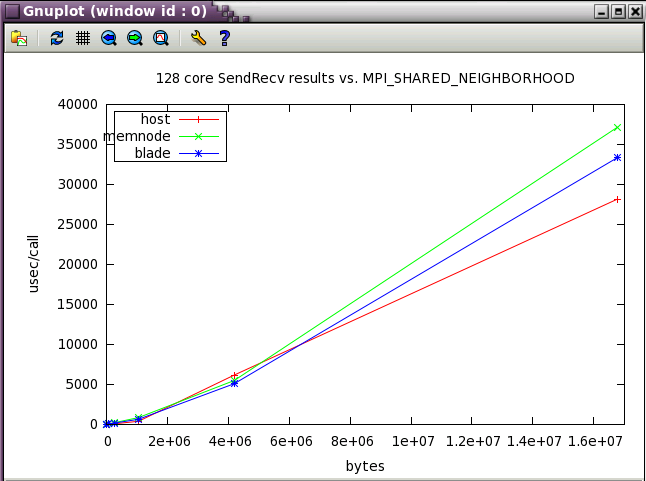
Ember MPT tuning for PARATEC
Ember MPT tuning for HPL
The HPL benchmark was run while varying MPI_SHARED_NEIGHBORHOOD 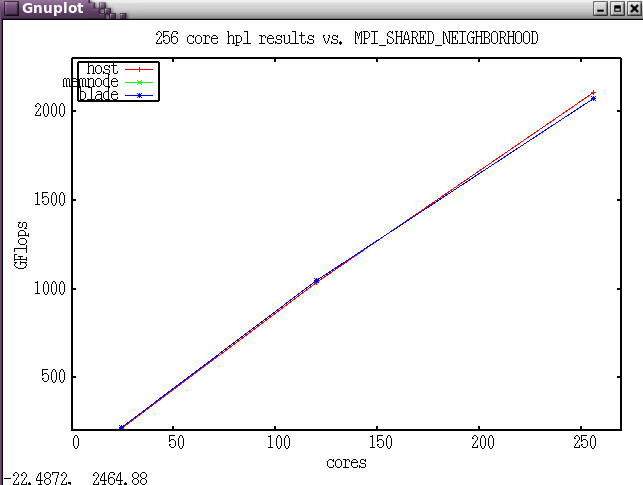
Perfboost case studies
Enabling Third Party Software Applications to Run Efficiently with MPT and PerfBoost on NCSA’s SGI/UV 1000
HP-MPI fails to set process affinity and results in an unbalanced distribution of MPI processes per core when running popular third party software compiled exclusively with HP-MPI such as Abaqus, Ansys/Fluent, and Accelerus and on a system which has Linux CPUSETs configured such as SGI/UV 1000. Several cores will have multiple MPI processes when there should be only one MPI process per core. The unbalanced distribution of MPI processes impacts software scaling and causes unpredictable runtimes. There is no work around to set the process affinity of the explicit MPI processes on a system with Linux CPUSETs enabled such as the SGI UV 1000 with Numalink.
One natural resolution of this issue would be the Itanium2 based SGI Altix. Unfortunately only LSTC currently has a supported MPT port on x86-64 with LS-Dyna, while other ISVs are listing economic reasons for focusing only on HP-MPI DMP support on x86-64. It is also uncertain when and how Platform MPI (formerly HP-MPI) will fully support Linux CPUSETs with Numalink in future.
As a consequence of this situation, SGI is providing a tool called PerfBoost, included in SGI ProPack on Altix/UV 1000, which enables access to the MPI Offload Engine (MOE) without the need for a recompile. MPI PerfBoost enables applications compiled with Platform MPI (formerly HP-MPI), Open-MPI and Intel MPI to be accelerated via the MOE. MPI PerfBoost enables the MPI calls from the application to use the equivalent SGI MPT call which is performance optimized by the MOE. Unfortunately the mpirun command is not easily accessible for these complex software packages, and it is often executed by layers of middleware software such as Python. Moreover, some HP-MPI mpirun command line options differ from SGI MPT’s, which creates additional difficulties and requires direct support from ISVs and SGI when porting these applications to MPT with PerfBoost.
Early porting tests were performed with the x86-64 HP-MPI executable of LS-Dyna copied from NCSA’s Intel64 DMP cluster “abe”, which has a simple mpirun interface without specific HP-MPI command line options. It was noticed that LS-Dyna performance was indeed “boosted” by as much as two times, and it was comparable to Dyna’s native MPT port performance.
Later, NCSA engineering applications analyst Seid Koric worked with SGI’s engineer Scott Shaw, and Simula’s engineer John Mangili in creating and testing the Abaqus 6.10 environment that loads PerfBoost and runs MPT’s mpirun with several Abaqus HP-MPI executables. This work lasted for a several weeks and resulted in a relatively stable Abaqus port which is currently in production on ember. All 3 major Abaqus FE solvers: Implicit Direct, Implicit Iterative, and Explicit have improved their performance by as much as 2.5x compared to corresponding ”plain HP-MPI” Abaqus runs on ember. However, some over allocation of requested in-core memory is experienced with Abaqus implicit FE solvers with this environment. This is especially severe with the direct solver when solving large highly nonlinear problems that uses as much as 3x more memory than originally requested. The users are recommended to request 3x more memory from PBS compared to Abaqus in-core memory requests when running these types of problems to avoid termination of these jobs by memory limits on ember.
SGI recommends enabling topological awareness with Torque on ember which would minimize communication penalties with Numalink for communication bound large implicit FE jobs using more than 48 cores (4 blades), but that would likely introduce a less efficient usage of computational resources on ember.
Additional 5-10% performance improvement was experienced with the large implicit jobs when i/o was forced to the local disks instead of the gpfs shared file system.
The current efforts are focused on enabling the Ansys/Fluent solver to run with PerfBoost under MPT on ember, and NCSA’s CFD analyst Ahmed Taha has been testing the initial Fluent 13 port on ember which was recently customized by Ansys Inc.
taskset examples
Note that with SLES and RH distributions, numa tools are usually found in 2 rpms:
arnoldg@ember:~> rpm -qf `which taskset`
util-linux-2.16-6.8.2
arnoldg@ember:~> rpm -qf `which numactl`
numactl-2.0.3-0.4.3
arnoldg@ember:~>
The following examples were run on ember.ncsa.illinois.edu within a batch job using cpusets.
stream
The stream benchmark with 2 openmp threads reveals the memory bandwidth penalty for using memory on a remote NUMA node.
# LOCAL NUMA, 1 board, 2 total cores
taskset -c 96,97 ./stream | grep Triad:
Function      Rate (MB/s)   Avg time     Min time     Max time
Triad:       9334.9373       0.0052       0.0051       0.0053

# REMOTE NUMA, 2 boards, 2 total cores
taskset -c 96,180 ./stream | grep Triad:
Function      Rate (MB/s)   Avg time     Min time     Max time
Triad:       4940.7724       0.0098       0.0097       0.0098
mpi pingpong
MPI pingpong shows a similar effect in reduced bandwidth for ranks on distant NUMA nodes.
# LOCAL NUMA, 1 board, 2 total cores
mpirun -np 2 taskset -c 96,97 ping_pong
...
  iter =            2

  least squares fit:  time = a + b * (msg length)
     a = latency =     0.50 microseconds
     b = inverse bandwidth =  0.00021 secs/Mbyte
     1/b = bandwidth =  4768.29 Mbytes/sec

     message         observed          fitted
  length(bytes)     time(usec)       time(usec)

      1000.             0.78             0.71
      2000.             0.98             0.92
      3000.             1.13             1.13
      4000.             1.33             1.34
      5000.             1.56             1.55
      6000.             1.71             1.76
      7000.             1.93             1.97
      8000.             2.10             2.18
      9000.             2.30             2.39
     10000.             3.00             2.60

# REMOTE NUMA, 2 boards, 2 total cores, MPI_SHARED_NEIGHBORHOOD=HOST
mpirun -np 2 taskset -c 96,180 ping_pong
...
  iter =            2

  least squares fit:  time = a + b * (msg length)
     a = latency =     5.44 microseconds
     b = inverse bandwidth =  0.00197 secs/Mbyte
     1/b = bandwidth =   507.31 Mbytes/sec

     message         observed          fitted
  length(bytes)     time(usec)       time(usec)

      1000.             6.30             7.41
      2000.             8.78             9.38
      3000.             9.52            11.35
      4000.            12.12            13.32
      5000.            15.18            15.29
      6000.            16.09            17.27
      7000.            19.01            19.24
      8000.            20.32            21.21
      9000.            22.58            23.18
     10000.            25.24            25.15