Contributors
Seid Koric
Greg Bauer
Rick Kufrin
Rui Liu
Susan John
Galen Arnold
Hardware review
SGI UV-1000 systems
Intel X7560 8core (HT) 2.27GHz |
64G/socket |
2 sockets/blade |
256 blades in a single system |
4096 cores/host |
|
Intel X7542 6core 2.67GHz |
32G/socket |
2 sockets/blade |
32x4 blades (4 systems) |
384 cores/host (1536 total) |
|
Intel X7550 8core (HT) 2.0GHz |
32G/socket |
2 sockets/blade |
64 blades in a single system |
1024 cores/host |
MPI_ environment variable settings
Every MPI tries to provide reasonable default settings that provide good performance for typical applications. What is typical with respect to tuning MPI?
- applications using < 128 ranks
- message sizes <= 4M
As we'll see in the plots and tests that follow, on ember.ncsa.illinois.edu the default tunings work well for many application message types. However when running with larger messages or with codes at scale (nranks > 128) the default tunings can throttle performance and it may be worth exploring the parameter space of some key MPI tunables for the SGI MPT implementation of MPI . The MPT man page for "man mpi" shows a handful* of environment variables (for large values of handful):
MPI_ARRAY
MPI_BAR_DISSEM (toggle)
MPI_BAR_TREE (toggle)
MPI_BUFFER_MAX
MPI_BUFS_PER_HOST
MPI_BUFS_PER_PROC
MPI_BUFS_THRESHOLD
MPI_CHECK_ARGS (toggle)
MPI_COLL_A2A_FRAG
MPI_COLL_GATHERV
MPI_COLL_OPT_VERBOSE (toggle)
MPI_COMM_MAX
MPI_CONNECTIONS_THRESHOLD
MPI_COREDUMP
MPI_COREDUMP_DEBUGGER
MPI_COREDUMP_VERBOSE (toggle)
MPI_CPR (toggle)
MPI_DEFAULT_SINGLE_COPY_BUFFER_MAX
MPI_DEFAULT_SINGLE_COPY_OFF (toggle)
MPI_DIR
MPI_DISPLAY_SETTINGS (toggle)
MPI_DSM_CPULIST
MPI_DSM_DISTRIBUTE (toggle)
MPI_DSM_OFF (toggle)
MPI_DSM_PPM
MPI_DSM_VERBOSE (toggle)
MPI_FASTSTART (toggle)
MPI_GROUP_MAX
MPI_GRU_BUFFER_MAX
MPI_GRU_CBS
MPI_GRU_DMA_CACHESIZE
MPI_IB_BUFFER_SIZE
MPI_IB_DEVS
MPI_IB_FAILOVER
MPI_IB_PAYLOAD
MPI_IB_RAILS
MPI_IB_RAILS_FLEXIBLE
MPI_IB_RECV_MSGS
MPI_IB_SERVICE_LEVEL
MPI_IB_SINGLE_COPY_BUFFER_MAX
MPI_IB_TIMEOUT
MPI_IB_VERBOSE (toggle)
MPI_IB_XRC (toggle)
MPI_LAUNCH_STDIO (toggle)
MPI_LAUNCH_TIMEOUT
MPI_MAPPED_HEAP_SIZE
MPI_MAPPED_STACK_SIZE
MPI_MAP_POWER2 (toggle)
MPI_MEMMAP_OFF (toggle)
MPI_MEMMAP_VERBOSE (toggle)
MPI_MSG_RETRIES
MPI_MSGS_MAX
MPI_MSGS_PER_PROC
MPI_NAP
MPI_OMP_NUM_THREADS
MPI_OPENMP_INTEROP (toggle)
MPI_REQUEST_MAX
MPI_RESET_PATH (toggle)
MPI_SHARED_NEIGHBORHOOD
MPI_SHARED_VERBOSE (toggle)
MPI_SIGTRAP
MPI_SIGTRAP_VERBOSE (toggle)
MPI_SLAVE_DEBUG_ATTACH
MPI_STATS_FILE
MPI_STATS (toggle)
MPI_TYPE_DEPTH
MPI_TYPE_MAX
MPI_UNBUFFERED_STDIO (toggle)
MPI_UNIVERSE
MPI_UNIVERSE_SIZE
MPI_USE_IB (toggle)
MPI_USE_TCP (toggle)
MPI_USE_UD (toggle)
MPI_USE_XPMEM (toggle)
MPI_VERBOSE2 (toggle)
MPI_VERBOSE (toggle)
MPI_XPMEM_VERBOSE (toggle)
That's not an unusually long list of tunables when compared to other implementations having a similar (or longer) list of options available as environment or cmd line options. This part of the tutorial focuses on those settings that we've found are important for functionality or performance. In many cases, the default settings for an option in the list above are reasonable and correct. Sometimes adjusting just one or two settings can yield significant performance benefits. Historical information: SGI has been developing MPT for over a decade .
MPI_MEMMAP_OFF
Some applications require this to be set (disabling single-copy transfers from within the MPI library) in order to run at scale. The defaults allow for memory mapping via the xpmem module to map memory between ranks.
MPI_BUFFER_MAX
This setting enables single-copy transfers of messages larger than MPI_BUFFER_MAX as long as xpmem is loaded and MPI_MEMMAP_OFF is not set. The single copy transfer may happen via shmem or over GRU (global reference unit) . MPI_BUFFER_MAX is not set to any value and hence not enabled by default.
Setting this variable can have a large effect on performance depending on message size. For example, setting this to a small value greatly boosts ping_pong performance via shared memory communication (scroll to the final example in the taskset section to see the default performance of approx. 1/2 the bandwidth) :
export MPI_BUFFER_MAX=1000
export MPI_SHARED_NEIGHBORHOOD=MEMNODE
mpirun -np 2 taskset -c 12,348 ping_pong
...
  least squares fit:  time = a + b * (msg length)
     a = latency =     7.14 microseconds
     b = inverse bandwidth =  0.00041 secs/Mbyte
     1/b = bandwidth =  2419.32 Mbytes/sec

     message         observed          fitted
  length(bytes)     time(usec)       time(usec)

      1000.             8.07             7.55
      2000.             7.96             7.96
      3000.             8.18             8.38
      4000.             8.68             8.79
      5000.             9.21             9.20
      6000.             9.47             9.62
      7000.             9.81            10.03
      8000.            10.29            10.44
      9000.            10.74            10.86
     10000.            11.11            11.27

mpirun -np 2 taskset -c 12,13 ping_pong
...
  least squares fit:  time = a + b * (msg length)
     a = latency =     0.52 microseconds
     b = inverse bandwidth =  0.00014 secs/Mbyte
     1/b = bandwidth =  7121.50 Mbytes/sec

     message         observed          fitted
  length(bytes)     time(usec)       time(usec)

      1000.             0.78             0.66
      2000.             0.87             0.80
      3000.             0.96             0.94
      4000.             1.09             1.08
      5000.             1.28             1.22
      6000.             1.39             1.36
      7000.             1.51             1.50
      8000.             1.61             1.64
      9000.             1.78             1.78
     10000.             2.01             1.92
MPI_BUFFER_MAX parameter sweep with IMB benchmark
A variety of message sizes from 4k through 64MB were tested with various settings of MPI_BUFFER_MAX. The following table and gnuplots present the data from the benchmarks. Here's a typical output stanza from IMB and a small 12 core test. As test size was scaled up, the max test message size was reduced to 16MB.
#---------------------------------------------------
# Benchmarking PingPong
# #processes = 2
# ( 10 additional processes waiting in MPI_Barrier)
#---------------------------------------------------
       #bytes #repetitions      t[usec]   Mbytes/sec
         4096         1000         1.41      2770.67
        16384         1000         3.90      4010.95
        65536          640        11.49      5437.97
       262144          160        43.03      5809.79
      1048576           40       153.41      6518.47
      4194304           10       828.21      4829.68
     16777216            2      4887.61      3273.58
     67108864            1     19795.56      3233.05
The job script was similar to :
#!/bin/bash
# Set maximum wallclock time to 30 minutes (hh:mm:ss)
#PBS -l walltime=00:15:00
#PBS -q normal
#PBS -l mem=48gb
#PBS -l ncpus=12
#PBS -V
#PBS -N imb12
#

HOST=`hostname`
export IMBDIR=$HOME/IMB_3.1
export IMB=$IMBDIR/src/IMB-MPI1

echo "EXEC_HOST=${HOST}"

cd $HOME/IMB_3.1/mpi_env_tests

echo "MPT DEFAULTS"
time mpirun -v -np $TOT_NCPUS $IMB -npmin $TOT_NCPUS -mem 3gb -msglen msglens12 -input input

export MPI_BUFFER_MAX=4096
while (expr $MPI_BUFFER_MAX \< 60000000) > /dev/null
do
  echo "MPI_BUFFER_MAX= $MPI_BUFFER_MAX"
  time mpirun -np $TOT_NCPUS $IMB -npmin $TOT_NCPUS -mem 3gb -msglen msglens12 -input input
  MPI_BUFFER_MAX=`expr $MPI_BUFFER_MAX \* 4`
done
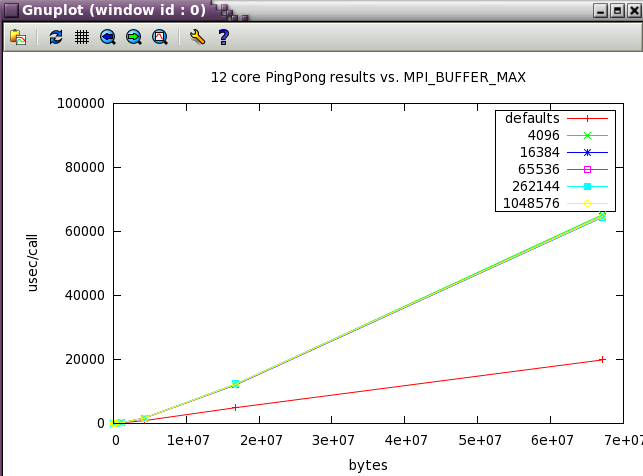
The first set in the study was run with 12 core (2 NUMA nodes on ember).
The default buffering is clearly best for small jobs and ping pong communication style.
Note: PingPong runs with only 2 processes (cores).
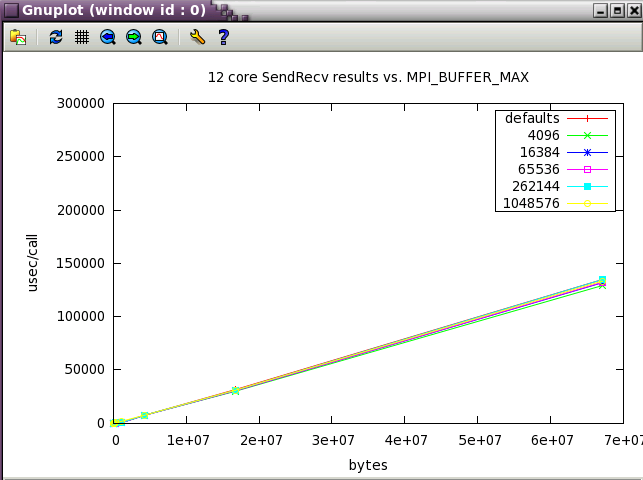
SendRecv showed little variation with changes in buffer size.
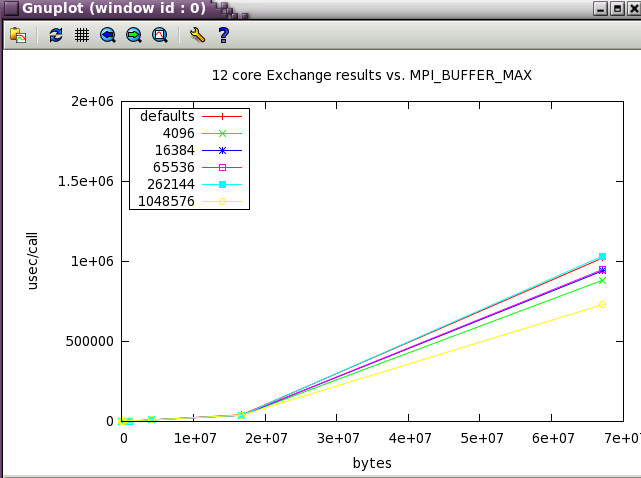
While there's some variation with an Exchange comm. pattern, it's only with large (64M ) messages.
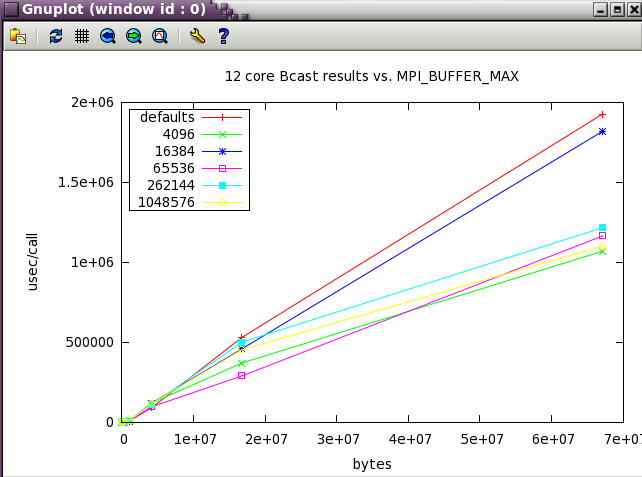
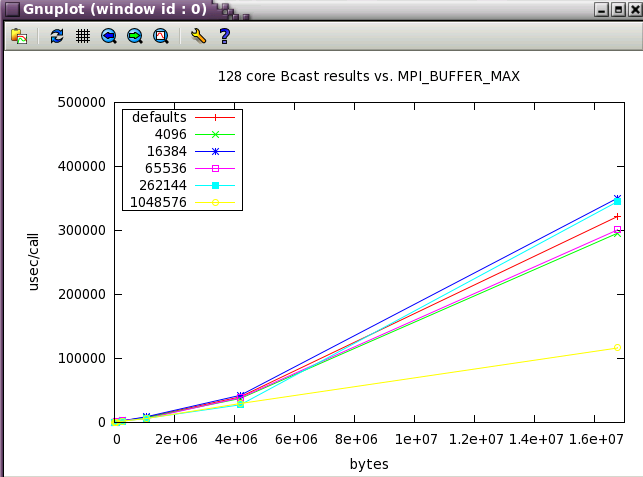
Bcast shows more variation with buffer size and it's possible to best the default settings at moderate (4M) message sizes.
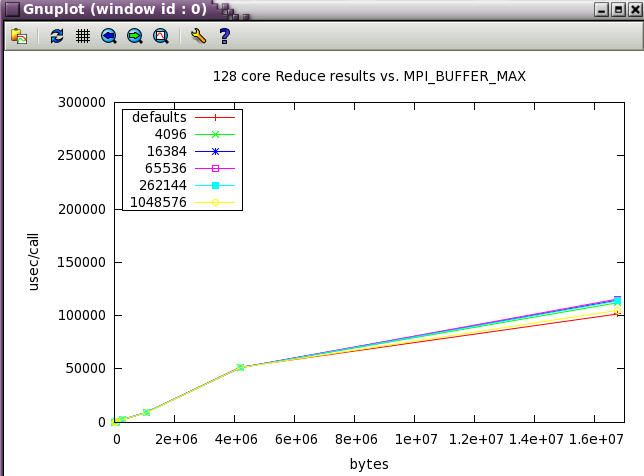
With Reduce, the defaults are the best settings.
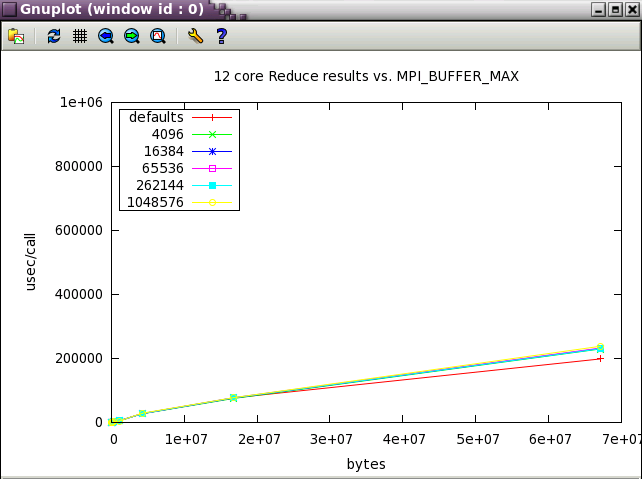
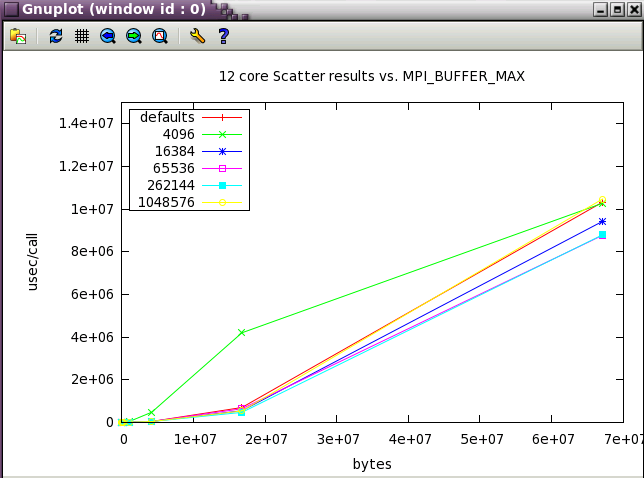
The defaults are good for scatter until the message size becomes large.
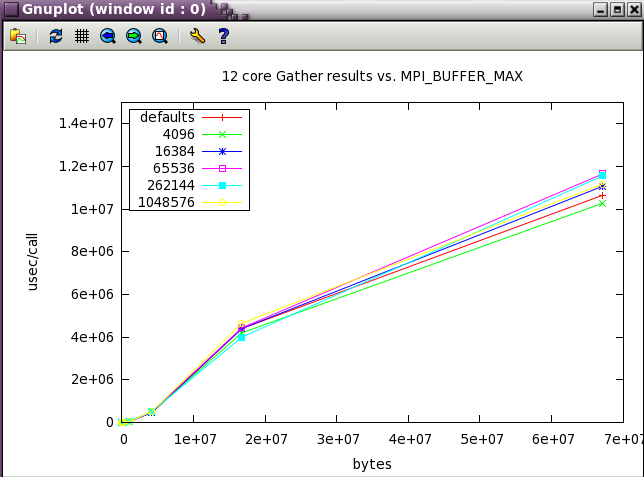
Gather also highlights the value of the default settings.
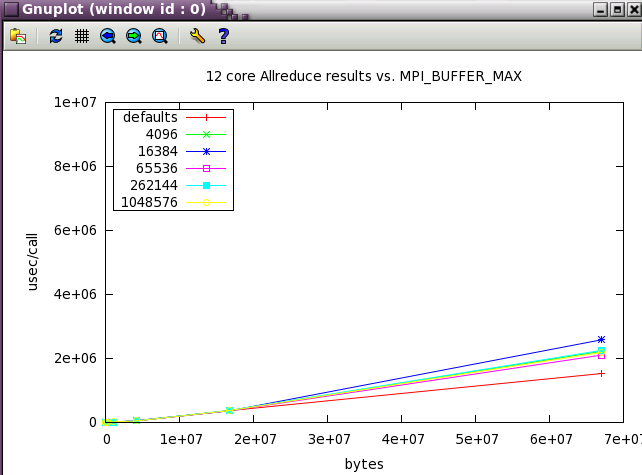
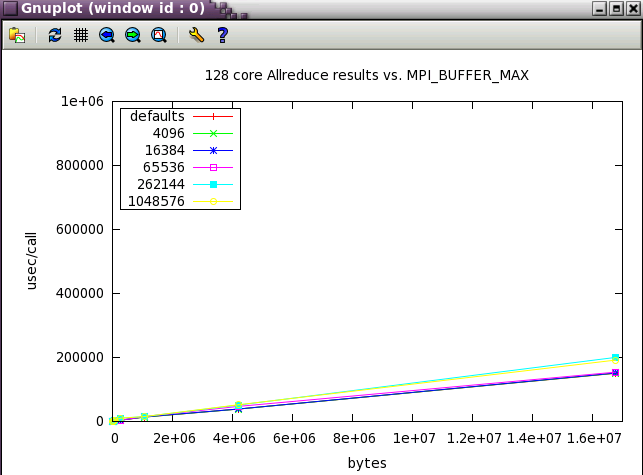
Again with Allreduce, the defaults are best.
The default settings are good for Alltoall as well.
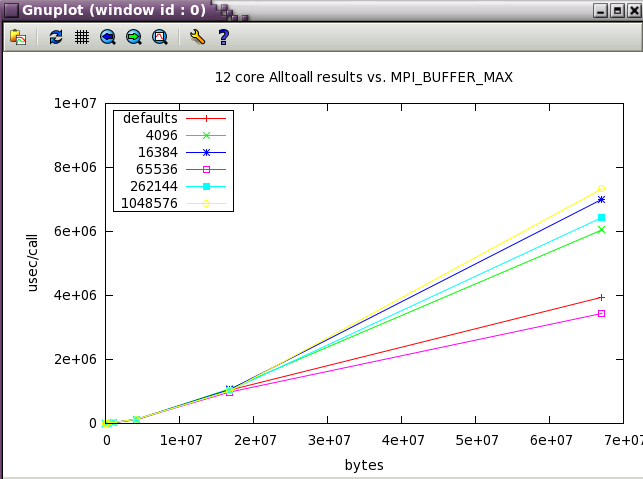
Next, a subset of the tests above were run at a wider scale of 128 cores (22 NUMA nodes). 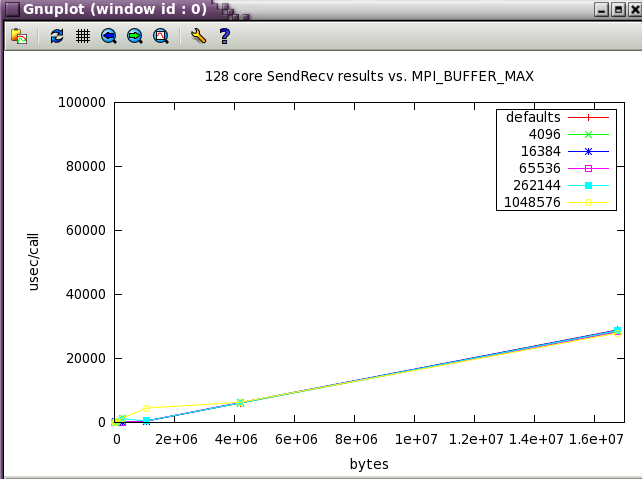
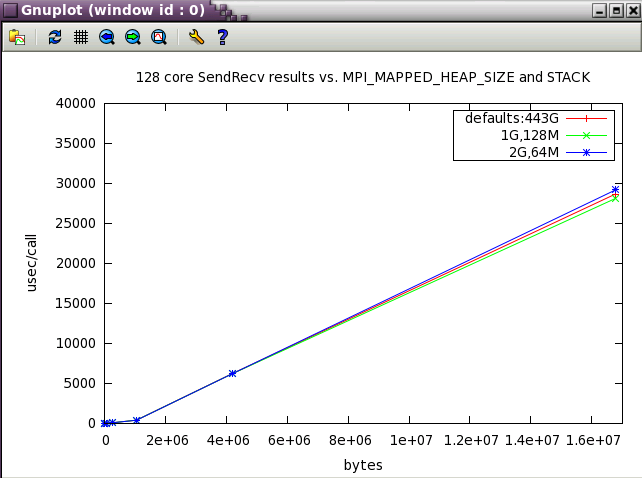
MPI_MAPPED_HEAP_SIZE
This is the heap size per MPI process and is inherited from the avail. memory provided by the batch environment. Due to the way some batch systems set job memory limits, it may end up being much larger than expected for large jobs--causing errors for jobs at scale.
For large scale apps, setting this to -1 or 0 (disabling it) or a reasonable value like 2G ( 2000000000 ) may be necessary .
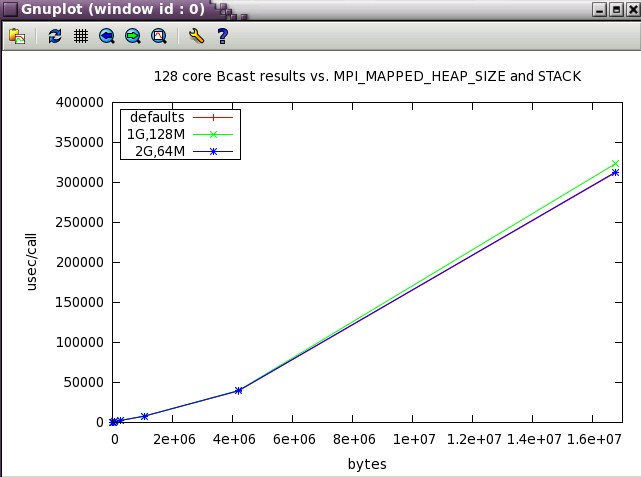
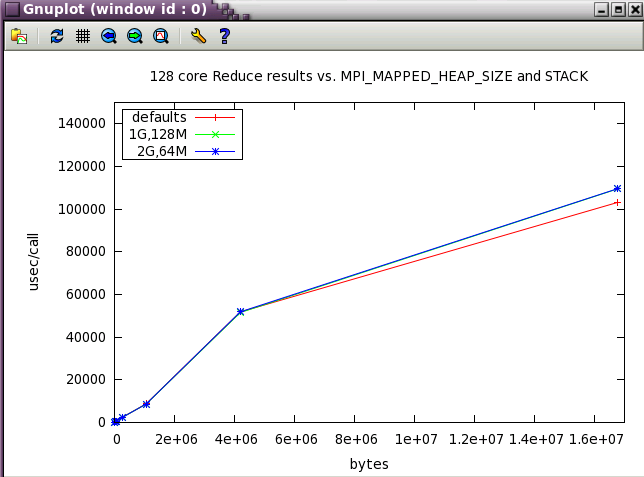
MPI_MAPPED_HEAP_SIZE parameter sweep with IMB benchmark
The same subset of tests from above was run with 128 cores while varying MPI_MAPPED_HEAP_SIZE and MPI_MAPPED_STACK_SIZE from their defaults.
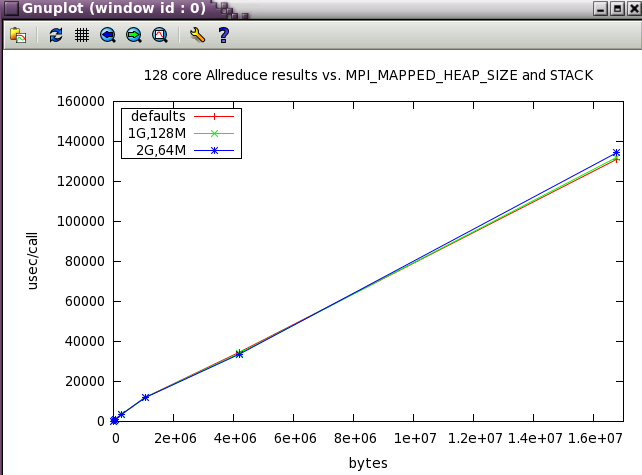
MPI_MAPPED_STACK_SIZE
Set to the shell limit, typically : 131072000
MPI_SHARED_NEIGHBORHOOD
For HPL, setting MPI_SHARED_NEIGHBORHOOD=HOST provides the best performance, but for other codes, that may not be the preferred setting. Global Reference Unit (GRU) communication is used for MPI ranks in different MPI_SHARED_NEIGHBORHOODs. The ping_pong example below using 2 cores in different nodes gives better performance with settings of BLADE or MEMNODE:
export MPI_SHARED_NEIGHBORHOOD=MEMNODE
mpirun -np 2 taskset -c 12,348 ping_pong
...
  least squares fit:  time = a + b * (msg length)
     a = latency =     7.49 microseconds
     b = inverse bandwidth =  0.00069 secs/Mbyte
     1/b = bandwidth =  1446.81 Mbytes/sec

     message         observed          fitted
  length(bytes)     time(usec)       time(usec)

      1000.             8.01             8.18
      2000.             8.84             8.87
      3000.             9.37             9.57
      4000.            10.02            10.26
      5000.            10.86            10.95
      6000.            11.64            11.64
      7000.            12.36            12.33
      8000.            12.83            13.02
      9000.            13.72            13.71
     10000.            14.53            14.40
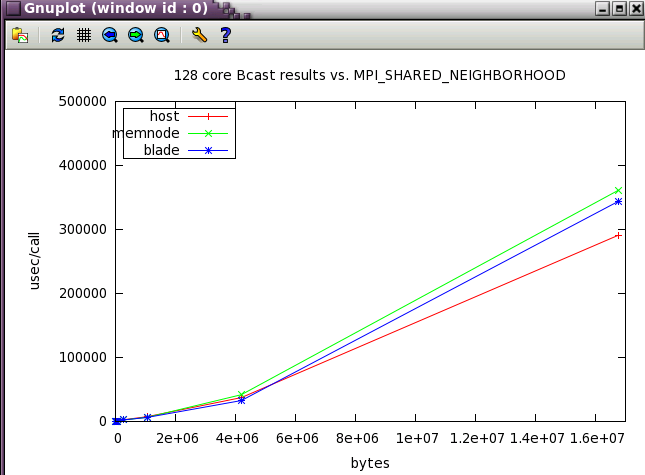
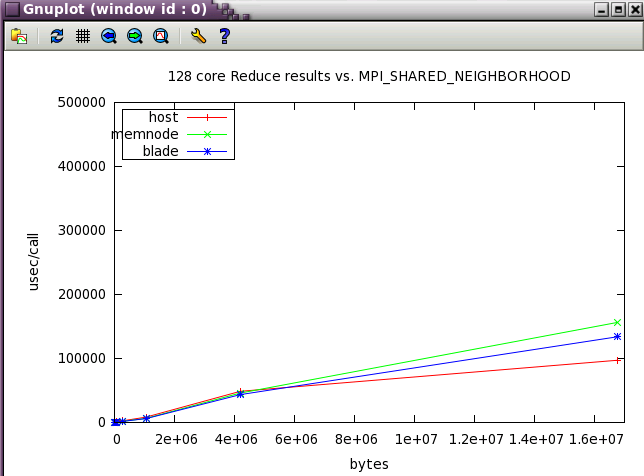
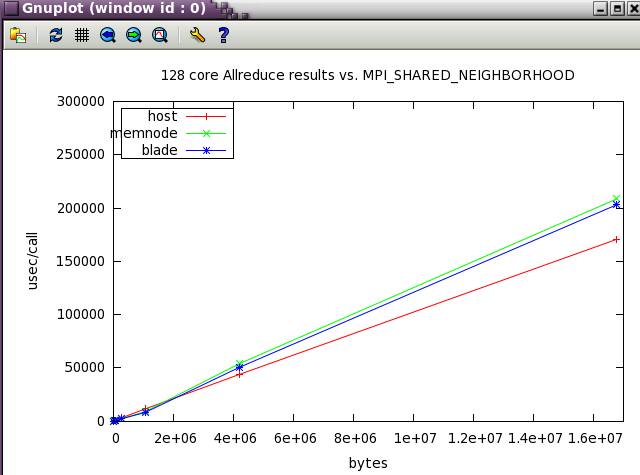
MPI_SHARED_NEIGHBORHOOD parameter sweep with IMB benchmark
The same IMB 128 core tests from above were run while varying MPI_SHARED_NEIGHBORHOOD. Notice how the optimum setting changes as the message size increases. 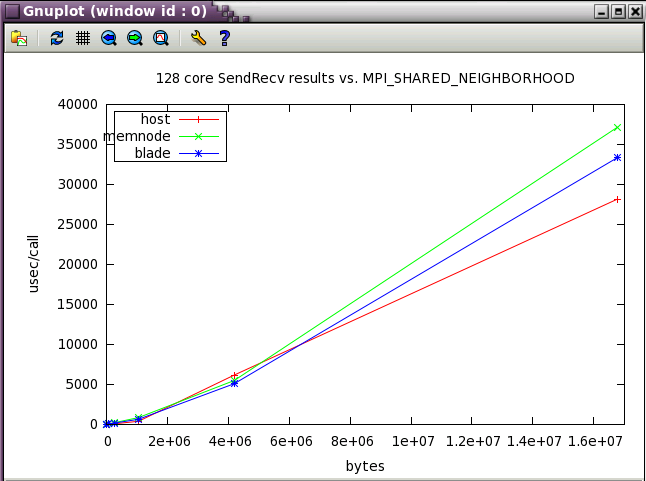
Ember MPT tuning for PARATEC
Ember MPT tuning for HPL
The HPL benchmark was run while varying MPI_SHARED_NEIGHBORHOOD. Notice the crossover past 128 cores where setting MPI to communicate via shared memory across the entire host results in higher GFlops. 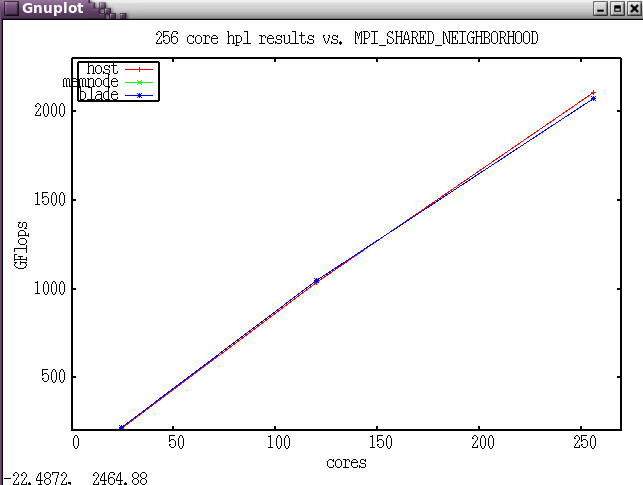
How to determine your MPI communication profile.
If you don't know the communication pattern (MPI calls, message sizes) it's relatively easy to profile an application and determine those values.
MpiP library
$ module help mpip

----------- Module Specific Help for 'mpip/intel/3.2.1' -----------

#####
The MPIP 3.2.1 library built with the Intel compilers.
To compile: add the compiler flag: -g
To link: ifort|icc -L $MPIP_LIBPATH -lmpiP -lmpi -lz -lbfd  -liberty -lunwind -lm
  # libs should be at the end of the link cmd line
Please see http://hpcsoftware.ncsa.illinois.edu/Software/user/show_asset.php?asset_id=XXXX
or http://mpip.sourceforge.net/
for more information.
####
After running the re-linked application, the mpiP profiling output will be in a file with .mpiP suffix.
@ mpiP
@ Command : /u/ncsa/arnoldg/IMB_3.1/src/IMB-MPI1 -npmin 12 -mem 3gb -msglen msglens12 -input input
@ Version                  : 3.2.1
@ MPIP Build date          : Apr 25 2011, 16:36:06
@ Start time               : 2011 05 06 14:15:22
@ Stop time                : 2011 05 06 14:16:39
@ Timer Used               : PMPI_Wtime
@ MPIP env var             : [null]
@ Collector Rank           : 0
@ Collector PID            : 375965
@ Final Output Dir         : .
@ Report generation        : Single collector task
@ MPI Task Assignment      : 0 ember-cmp3
@ MPI Task Assignment      : 1 ember-cmp3
@ MPI Task Assignment      : 2 ember-cmp3
@ MPI Task Assignment      : 3 ember-cmp3
@ MPI Task Assignment      : 4 ember-cmp3
@ MPI Task Assignment      : 5 ember-cmp3
@ MPI Task Assignment      : 6 ember-cmp3
@ MPI Task Assignment      : 7 ember-cmp3
@ MPI Task Assignment      : 8 ember-cmp3
@ MPI Task Assignment      : 9 ember-cmp3
@ MPI Task Assignment      : 10 ember-cmp3
@ MPI Task Assignment      : 11 ember-cmp3

---------------------------------------------------------------------------
@--- MPI Time (seconds) ---------------------------------------------------
---------------------------------------------------------------------------
Task    AppTime    MPITime     MPI%
   0       76.9       68.1    88.57
   1         77       69.2    89.91
   2         77       69.4    90.23
   3         77       69.4    90.23
   4         77       69.6    90.34
   5         77       69.2    89.92
   6         77         70    90.95
   7       76.9       70.1    91.12
   8       76.9         70    91.01
   9         77       70.2    91.15
  10       76.9       70.2    91.22
  11       76.9       69.9    90.91
   *        923        835    90.46
---------------------------------------------------------------------------
@--- Callsites: 8 ---------------------------------------------------------
---------------------------------------------------------------------------
 ID Lev File/Address        Line Parent_Funct             MPI_Call
  1   0 IMB_warm_up.c        141 IMB_warm_up              Isend
  2   0 0x2b1fac421bc5           [unknown]                Barrier
  3   0 IMB.c                366 main                     Comm_free
  4   0 IMB.c                270 main                     Bcast
  5   0 IMB_init.c           845 IMB_init_communicator    Comm_split
  6   0 IMB.c                139 main                     Bcast
  7   0 IMB.c                181 main                     Recv
  8   0 IMB.c                280 main                     Gather
---------------------------------------------------------------------------
@--- Aggregate Time (top twenty, descending, milliseconds) ----------------
---------------------------------------------------------------------------
Call                 Site       Time    App%    MPI%     COV
Gather                  4   3.72e+05   40.28   44.52    0.10
Scatter                 4   1.52e+05   16.45   18.18    0.02
Alltoall                4   8.75e+04    9.48   10.48    0.00
Bcast                   4   6.28e+04    6.80    7.51    0.13
Allreduce               4   5.31e+04    5.74    6.35    0.07
Barrier                 2    4.7e+04    5.09    5.62    1.06
Barrier                 4   1.96e+04    2.12    2.34    0.31
Reduce                  4   1.74e+04    1.88    2.08    0.12
Recv                    4   1.14e+04    1.24    1.37    0.81
Waitall                 4   6.45e+03    0.70    0.77    1.39
Sendrecv                4   4.39e+03    0.47    0.52    0.27
Bcast                   6   1.11e+03    0.12    0.13    0.36
Isend                   4        173    0.02    0.02    0.26
Barrier                 1        140    0.02    0.02    0.05
Send                    4        126    0.01    0.02    0.02
Comm_free               5       71.5    0.01    0.01    0.18
Gather                  8       66.1    0.01    0.01    0.48
Comm_split              5       61.1    0.01    0.01    0.43
Isend                   1       52.6    0.01    0.01    0.61
Recv                    1       38.7    0.00    0.00    0.54
---------------------------------------------------------------------------
@--- Aggregate Sent Message Size (top twenty, descending, bytes) ----------
---------------------------------------------------------------------------
Call                 Site      Count      Total       Avrg  Sent%
Isend                   4      68472   6.93e+09   1.01e+05  21.82
Gather                  4      34236   3.47e+09   1.01e+05  10.91
Reduce                  4      34236   3.47e+09   1.01e+05  10.91
Sendrecv                4      34236   3.47e+09   1.01e+05  10.91
Scatter                 4      34236   3.47e+09   1.01e+05  10.91
Alltoall                4      34236   3.47e+09   1.01e+05  10.91
Allreduce               4      34236   3.47e+09   1.01e+05  10.91
Bcast                   4      34236   3.47e+09   1.01e+05  10.91
Send                    4       5706   5.78e+08   1.01e+05   1.82
Gather                  8        864   6.91e+03          8   0.00
Bcast                   6         48   1.58e+03         33   0.00
Send                    7         99        396          4   0.00
Isend                   1         48        192          4   0.00
Gather                  1         24         96          4   0.00
Reduce                  1         24         96          4   0.00
Sendrecv                1         24         96          4   0.00
Scatter                 1         24         96          4   0.00
Alltoall                1         24         96          4   0.00
Allreduce               1         24         96          4   0.00
Bcast                   1         24         96          4   0.00
---------------------------------------------------------------------------
@--- Callsite Time statistics (all, milliseconds): 354 --------------------
---------------------------------------------------------------------------
Name              Site Rank  Count      Max     Mean      Min   App%   MPI%
Allreduce            1    0      2     1.84    0.925   0.0154   0.00   0.00
Allreduce            1    1      2     1.84    0.925   0.0149   0.00   0.00
Allreduce            1    2      2     1.84    0.926   0.0156   0.00   0.00
Allreduce            1    3      2     1.84    0.926   0.0159   0.00   0.00
Allreduce            1    4      2     1.84    0.928   0.0187   0.00   0.00
Allreduce            1    5      2     1.84    0.928   0.0185   0.00   0.00
Allreduce            1    6      2     1.84    0.927   0.0181   0.00   0.00
Allreduce            1    7      2     1.84    0.928   0.0173   0.00   0.00
Allreduce            1    8      2     1.83    0.927   0.0198   0.00   0.00
Allreduce            1    9      2     1.83    0.927   0.0199   0.00   0.00
Allreduce            1   10      2     1.84    0.926   0.0175   0.00   0.00
Allreduce            1   11      2     1.84    0.926   0.0168   0.00   0.00
Allreduce            1    *     24     1.84    0.927   0.0149   0.00   0.00

Allreduce            4    0   2853  2.1e+03     1.61   0.0438   5.99   6.76
Allreduce            4    1   2853 1.52e+03      1.4   0.0321   5.20   5.78
Allreduce            4    2   2853 1.37e+03     1.35   0.0375   5.00   5.55
Allreduce            4    3   2853 1.36e+03     1.35   0.0376   5.00   5.54
...
...
...
---------------------------------------------------------------------------
@--- Callsite Message Sent statistics (all, sent bytes) -------------------
---------------------------------------------------------------------------
Name              Site Rank   Count       Max      Mean       Min       Sum
Allreduce            1    0       2         4         4         4         8
Allreduce            1    1       2         4         4         4         8
Allreduce            1    2       2         4         4         4         8
Allreduce            1    3       2         4         4         4         8
Allreduce            1    4       2         4         4         4         8
Allreduce            1    5       2         4         4         4         8
Allreduce            1    6       2         4         4         4         8
Allreduce            1    7       2         4         4         4         8
Allreduce            1    8       2         4         4         4         8
Allreduce            1    9       2         4         4         4         8
Allreduce            1   10       2         4         4         4         8
Allreduce            1   11       2         4         4         4         8
Allreduce            1    *      24         4         4         4        96

Allreduce            4    0    2853 6.711e+07 1.013e+05      4096 2.889e+08
Allreduce            4    1    2853 6.711e+07 1.013e+05      4096 2.889e+08
Allreduce            4    2    2853 6.711e+07 1.013e+05      4096 2.889e+08
Allreduce            4    3    2853 6.711e+07 1.013e+05      4096 2.889e+08
Allreduce            4    4    2853 6.711e+07 1.013e+05      4096 2.889e+08
Allreduce            4    5    2853 6.711e+07 1.013e+05      4096 2.889e+08
Allreduce            4    6    2853 6.711e+07 1.013e+05      4096 2.889e+08
Allreduce            4    7    2853 6.711e+07 1.013e+05      4096 2.889e+08
Allreduce            4    8    2853 6.711e+07 1.013e+05      4096 2.889e+08
Allreduce            4    9    2853 6.711e+07 1.013e+05      4096 2.889e+08
Allreduce            4   10    2853 6.711e+07 1.013e+05      4096 2.889e+08
Allreduce            4   11    2853 6.711e+07 1.013e+05      4096 2.889e+08
Allreduce            4    *   34236 6.711e+07 1.013e+05      4096 3.467e+09
Note that callsites may occur for multiple tests (particularly callsite 4 ):
4 0 IMB.c 270 main Bcast
This is due to the way that line is called in the code:
265 // IMB_init_buffers_iter has decided failure when memory usage exceeds limit:
266                 if( !Bmark->sample_failure ){
267
268                 IMB_warm_up  (&C_INFO,Bmark,&ITERATIONS,iter);
269
270                 Bmark->Benchmark(&C_INFO,size,&ITERATIONS,BMODE,time);
271
272                 }
273 /* >> IMB 3.1  */
274
SGI perfcatch
perfcatch doc. at techpubs.sgi.com
Re-link is not needed. This library/tool just requires a runtime change:
   export PATH=$PATH:/usr/local/sgi/perfcatcher/perfcatcher-25/bin
   time mpirun -np $TOT_NCPUS perfcatch $IMB -npmin $TOT_NCPUS -mem 3gb -msglen msglens12 -input input
Perfcatch profiling output is in MPI_PROFILING_STATS unless the environment variable MPI_PROFILING_STATS_FILE defines an alternate filename.
============================================================
PERFCATCHER version 25
(C) Copyright SGI.  This library may only be used
on SGI hardware platforms. See LICENSE file for
details.
============================================================
MPI/SHMEM program profiling information
Job profile recorded:         Thu May  5 14:28:38 2011
Program command line:         /u/ncsa/arnoldg/IMB_3.1/src/IMB-MPI1 -npmin 12 -mem 3gb -msglen msglens12 -input input
Total MPI/SHMEM processes:    12

Total MPI/SHMEM job time, avg per rank                      73.003 sec
Profiled job time, avg per rank                             73.003 sec
Percent job time profiled, avg per rank                     100%

Total user time, avg per rank                               23.665 sec
Percent user time, avg per rank                             32.4165%
Total system time, avg per rank                             10.3467 sec
Percent system time, avg per rank                           14.1729%

Time in all profiled MPI/SHMEM functions, avg per rank      68.4433 sec
Percent time in profiled MPI/SHMEM functions, avg per rank  93.7541%


Rank-by-Rank Summary Statistics
-------------------------------

Rank-by-Rank: Percent in Profiled MPI/SHMEM functions
        Rank:Percent
        0:93.6154%      1:93.802%       2:93.69%        3:93.6974%
        4:93.8825%      5:93.8484%      6:93.8514%      7:93.685%
        8:93.6173%      9:93.6451%      10:93.852%      11:93.8622%

  Least:  Rank 0      93.6154%
  Most:   Rank 4      93.8825%
  Load Imbalance:  2.136174%

Rank-by-Rank: User Time
        Rank:Percent
        0:68.711%       1:51.0765%      2:46.6802%      3:25.2439%
        4:24.0971%      5:25.2858%      6:23.4496%      7:25.5227%
        8:25.8916%      9:24.6192%      10:23.4128%     11:24.9961%

  Least:  Rank 10      23.4128%
  Most:   Rank 0      68.711%

Rank-by-Rank: System Time
        Rank:Percent
        0:8.27217%      1:9.32773%      2:11.6974%      3:17.1215%
        4:16.4529%      5:16.3002%      6:15.9984%      7:14.1793%
        8:14.8637%      9:14.1249%      10:15.4533%     11:16.2851%

  Least:  Rank 0      8.27217%
  Most:   Rank 3      17.1215%


Notes
-----

Wtime resolution is                   5e-09 sec


Rank-by-Rank MPI Profiling Results
----------------------------------
Activity on process rank 0

  MPI activity
  comm_rank            calls:     11  time: 1.78791e-05 s  1.62537e-06 s/call
  comm_group           calls:     18  time: 3.22009e-05 s  1.78894e-06 s/call
  comm_free            calls:      9  time: 0.000789252 s  8.76946e-05 s/call
  recv                 calls:  11519  time:    2.49635 s  datacnt 1155662252
                       waits: 5  wait time: 0.00011255 s
            Average data size 100327  (min 4, max 67108864)   size:count(peer)
            67108864:   1x(-2)  67108864:   2x(11)  67108864:   1x(1)  16777216:   2x(-2)
            16777216:   2x(1)  16777216:   4x(11)  4194304:  10x(1)  4194304:  10x(-2)
            4194304:  20x(11)  1048576:  80x(11)  1048576:  40x(-2)  1048576:  40x(1)
            262144: 320x(11)  262144: 160x(1)  262144: 160x(-2)  65536: 640x(1)
            65536:1280x(11)  65536: 640x(-2)  16384:1000x(-2)  16384:2000x(11)
            16384:1000x(1)   4096:1000x(-2)   4096:1000x(1)   4096:2000x(11)
                4:  11x(1)      4:   9x(2)      4:   9x(3)      4:   9x(4)
                4:   9x(5)      4:   9x(6)      4:   9x(7)      4:   9x(8)
                4:   9x(9)      4:   9x(10)      4:  13x(11)      4:   2x(-2)
            unique peers:    -2    11     1     2     3     4     5     6     7     8     9    10
  send                 calls:   5710  time:   0.621604 s  datacnt 577830928
            Average data size 101196  (min 4, max 67108864)   size:count(peer)
            67108864:   2x(1)  16777216:   4x(1)  4194304:  20x(1)  1048576:  80x(1)
            262144: 320x(1)  65536:1280x(1)  16384:2000x(1)   4096:2000x(1)
                4:   4x(1)

            unique peers:     1

  isend                calls:   5710  time:  0.0197388 s  3.45689e-06 s/call
            Average data size 101196  (min 4, max 67108864)   size:count(peer)
            67108864:   1x(1)  67108864:   1x(11)  16777216:   2x(1)  16777216:   2x(11)
            4194304:  10x(1)  4194304:  10x(11)  1048576:  40x(1)  1048576:  40x(11)
            262144: 160x(1)  262144: 160x(11)  65536: 640x(1)  65536: 640x(11)
            16384:1000x(1)  16384:1000x(11)   4096:1000x(1)   4096:1000x(11)
                4:   2x(1)      4:   2x(11)

            unique peers:     1    11
  waitall              calls:   2855  time:  0.0275526 s  # of reqs 5710  avg datacnt 6
  barrier              calls:    234  time:    2.10696 s  0.00900409 s/call
  alltoall calls 2855   time 7.8679   avg datacnt 1.21436e+06
            Average data size 1.21436e+06  (min 48, max 805306368)   size:count(comm)
            805306368:   1x(6)  201326592:   2x(6)  50331648:  10x(6)  12582912:  40x(6)
            3145728: 160x(6)  786432: 640x(6)  196608:1000x(6)  49152:1000x(6)
               48:   2x(6)

            unique comms:     6

  reduce               calls:   2855  time:    1.89933 s  0.000665265 s/call
  allreduce            calls:   2855  time:     5.2637 s  0.00184368 s/call
            Average data size 101196  (min 4, max 67108864)   size:count(comm)
            67108864:   1x(6)  16777216:   2x(6)  4194304:  10x(6)  1048576:  40x(6)
            262144: 160x(6)  65536: 640x(6)  16384:1000x(6)   4096:1000x(6)
                4:   2x(6)

            unique comms:     6

  bcast                calls:   2859  time:    4.74815 s  0.00166077 s/call
            Average data size 101055  (min 4, max 67108864)   size:count(comm)
            67108864:   1x(6)  16777216:   2x(6)  4194304:  10x(6)  1048576:  40x(6)
            262144: 160x(6)  65536: 640x(6)  16384:1000x(6)   4096:1000x(6)
               52:   1x(1)     36:   1x(1)     32:   1x(1)     12:   1x(1)
                4:   2x(6)

            unique comms:     6     1

  gather               calls:   2927  time:    31.0776 s  0.0106175 s/call
  scatter              calls:   2855  time:    12.2245 s  0.00428178 s/call
Takeaway: SGI defaults are probably good for a majority of codes run at modest scales with modest message sizes. When running at scale or with large messages, it's best to experiment with the environment settings and try to improve performance. Some MPI implementations provide for automatic tuning of their parameters. See also:
Intel MPI , mpitune
Open-mpi , open tool for parameter optimization
Perfcatch would work with applications where source code is not available, like 3rd party licensed apps. SGI provides a nice solution for 3rd party codes built with a standard x86_64 MPI implementation-- Perfboost.
Perfboost case studies
Enabling Third Party Software Applications to Run Efficiently with MPT and PerfBoost on NCSA’s SGI/UV 1000
HP-MPI fails to set process affinity and results in an unbalanced distribution of MPI processes per core when running popular third party software compiled exclusively with HP-MPI such as Abaqus, Ansys/Fluent, and Accelerus and on a system which has Linux CPUSETs configured such as SGI/UV 1000. Several cores will have multiple MPI processes when there should be only one MPI process per core. The unbalanced distribution of MPI processes impacts software scaling and causes unpredictable runtimes. There is no work around to set the process affinity of the explicit MPI processes on a system with Linux CPUSETs enabled such as the SGI UV 1000 with Numalink.
One natural resolution of this issue would be the Itanium2 based SGI Altix. Unfortunately only LSTC currently has a supported MPT port on x86-64 with LS-Dyna, while other ISVs are listing economic reasons for focusing only on HP-MPI DMP support on x86-64. It is also uncertain when and how Platform MPI (formerly HP-MPI) will fully support Linux CPUSETs with Numalink in future.
As a consequence of this situation, SGI is providing a tool called PerfBoost, included in SGI ProPack on Altix/UV 1000, which enables access to the MPI Offload Engine (MOE) without the need for a recompile. MPI PerfBoost enables applications compiled with Platform MPI (formerly HP-MPI), Open-MPI and Intel MPI to be accelerated via the MOE. MPI PerfBoost enables the MPI calls from the application to use the equivalent SGI MPT call which is performance optimized by the MOE. Unfortunately the mpirun command is not easily accessible for these complex software packages, and it is often executed by layers of middleware software such as Python. Moreover, some HP-MPI mpirun command line options differ from SGI MPT’s, which creates additional difficulties and requires direct support from ISVs and SGI when porting these applications to MPT with PerfBoost.
Early porting tests were performed with the x86-64 HP-MPI executable of LS-Dyna copied from NCSA’s Intel64 DMP cluster “abe”, which has a simple mpirun interface without specific HP-MPI command line options. It was noticed that LS-Dyna performance was indeed “boosted” by as much as two times, and it was comparable to Dyna’s native MPT port performance.
Later, NCSA engineering applications analyst Seid Koric worked with SGI’s engineer Scott Shaw, and Simula’s engineer John Mangili in creating and testing the Abaqus 6.10 environment that loads PerfBoost and runs MPT’s mpirun with several Abaqus HP-MPI executables. This work lasted for a several weeks and resulted in a relatively stable Abaqus port which is currently in production on ember. All 3 major Abaqus FE solvers: Implicit Direct, Implicit Iterative, and Explicit have improved their performance by as much as 2.5x compared to corresponding ”plain HP-MPI” Abaqus runs on ember. However, some over allocation of requested in-core memory is experienced with Abaqus implicit FE solvers with this environment. This is especially severe with the direct solver when solving large highly nonlinear problems that uses as much as 3x more memory than originally requested. The users are recommended to request 3x more memory from PBS compared to Abaqus in-core memory requests when running these types of problems to avoid termination of these jobs by memory limits on ember.
SGI recommends enabling topological awareness with Torque on ember which would minimize communication penalties with Numalink for communication bound large implicit FE jobs using more than 48 cores (4 blades), but that would likely introduce a less efficient usage of computational resources on ember.
Additional 5-10% performance improvement was experienced with the large implicit jobs when i/o was forced to the local disks instead of the gpfs shared file system.
The current efforts are focused on enabling the Ansys/Fluent solver to run with PerfBoost under MPT on ember, and NCSA’s CFD analyst Ahmed Taha has been testing the initial Fluent 13 port on ember which was recently customized by Ansys Inc.
Cpusets and integration with PBS
cpuset information
The following commands will display the active cpuset information for use by the current shell. Notice that batch jobs are allocated in whole-processors (6 cores). These commands work for both the login and batch environments.
arnoldg@ember:~> cat ~/bin/mycpuset
cat /proc/self/cpuset
grep _allowed_list /proc/self/status

# interactive example
arnoldg@ember:~> ~/bin/mycpuset
/user
Cpus_allowed_list:	12-23
Mems_allowed_list:	2-3
arnoldg@ember:~>

# BATCH example
arnoldg@ember-cmp3:~> ~/bin/mycpuset
/PBSPro/71072.ember
Cpus_allowed_list:    336-341
Mems_allowed_list:    56
Compare with "numactl --hardware" to see how cpus and memory are laid out within linux:
arnoldg@ember-cmp3:~> numactl --hardware
available: 1 nodes (56)
node 56 cpus: 336 337 338 339 340 341
node 56 size: 32768 MB
node 56 free: 32258 MB
taskset examples
Note that with SLES and RH distributions, numa tools are usually found in 2 rpms:
arnoldg@ember:~> rpm -qf `which taskset`
util-linux-2.16-6.8.2
arnoldg@ember:~> rpm -qf `which numactl`
numactl-2.0.3-0.4.3
arnoldg@ember:~>
The following examples were run on ember.ncsa.illinois.edu within a batch job using cpusets.
stream
The stream benchmark with 2 openmp threads reveals the memory bandwidth penalty for using memory on a remote NUMA node.
# LOCAL NUMA, 1 board, 2 total cores
taskset -c 96,97 ./stream | grep Triad:
Function      Rate (MB/s)   Avg time     Min time     Max time
Triad:       9334.9373       0.0052       0.0051       0.0053

# REMOTE NUMA, 2 boards, 2 total cores
taskset -c 96,180 ./stream | grep Triad:
Function      Rate (MB/s)   Avg time     Min time     Max time
Triad:       4940.7724       0.0098       0.0097       0.0098
mpi pingpong
MPI pingpong shows a similar effect in reduced bandwidth for ranks on distant NUMA nodes.
# LOCAL NUMA, 1 board, 2 total cores
mpirun -np 2 taskset -c 96,97 ping_pong
...
  iter =            2

  least squares fit:  time = a + b * (msg length)
     a = latency =     0.50 microseconds
     b = inverse bandwidth =  0.00021 secs/Mbyte
     1/b = bandwidth =  4768.29 Mbytes/sec

     message         observed          fitted
  length(bytes)     time(usec)       time(usec)

      1000.             0.78             0.71
      2000.             0.98             0.92
      3000.             1.13             1.13
      4000.             1.33             1.34
      5000.             1.56             1.55
      6000.             1.71             1.76
      7000.             1.93             1.97
      8000.             2.10             2.18
      9000.             2.30             2.39
     10000.             3.00             2.60

# REMOTE NUMA, 2 boards, 2 total cores, MPI_SHARED_NEIGHBORHOOD=HOST
mpirun -np 2 taskset -c 96,180 ping_pong
...
  iter =            2

  least squares fit:  time = a + b * (msg length)
     a = latency =     5.44 microseconds
     b = inverse bandwidth =  0.00197 secs/Mbyte
     1/b = bandwidth =   507.31 Mbytes/sec

     message         observed          fitted
  length(bytes)     time(usec)       time(usec)

      1000.             6.30             7.41
      2000.             8.78             9.38
      3000.             9.52            11.35
      4000.            12.12            13.32
      5000.            15.18            15.29
      6000.            16.09            17.27
      7000.            19.01            19.24
      8000.            20.32            21.21
      9000.            22.58            23.18
     10000.            25.24            25.15
1 Comment
Galen Arnold
From:
Rick Kufrin <rkufrin@ncsa.illinois.edu>
Subject:
Re: [Fwd: NUMA library returning incorrect result ]
Unfortunately, NCSA can't control the behavior of libnuma or numactl on our
systems, nor can we change it. My guess is that numactl assumes complete
access to a system, but when you must slice up a system to serve a very large
user community as NCSA does, some things change that may violate utilities'
assumptions.
libnuma/numactl is apparently written by Andi Kleen of SuSE, so you may wish to
submit a bug report there or to linux-devel, which will eventually make it over
to SGI. That's going to take a while, though. In the meantime, I would suggest
a "roll your own" approach, as I said earlier. You don't say what information
you really need, only that numactl/libnuma is not providing it reliably. You
may be able to get at what you want through the /proc and /sys filesystems.
Bottom line is that I don't know what caused the incorrect results from
numactl, even though the underlying calls appeared to produce better
information. If it were me, I'd investigate accessing the underlying virtual
files directly.
Rick Kufrin
----- Original Message -----
From: "Liqi Yi" <yiliqi@gmail.com>
To: "Rick Kufrin" <rkufrin@ncsa.illinois.edu>
Sent: Thursday, March 17, 2011 9:22:17 PM
Subject: Re: NUMA library returning incorrect result
Dear Rick,
Thank you for the quick reply.
I did realize that numactl is returning incorrect results while the system
files are fine. My question is what caused these incorrect results and how to
make the NUMA library working properly. The application I am working on needs
to query hardware topology during the run time and currently the query is done
through NUMA library. So it will be very helpful if the NUMA library is working
properly.
Regards,
Liqi Yi |