Architecture
This section is intended to provide details about what components Bard provides to build new applications and the common extension points that developers will be interested in for extending the functionality of the base application.
Data Catalog
The Data Catalog provides access to data that has been ingested into all defined repositories, both local and remote. All repositories in the data catalog are defined at the ncsa.gis.repositoryTypes extension point and must extend the BaseRepository class and implement the Repository interface so that the system can discover them. Users can access the data catalog through the Data Catalog View. This view allows users to manage their defined repositories and provides the ability to browse the catalog, load data into scenarios, view dataset properties, add new repositories, delete repositories, and clear the local cache.
Repositories
List<DatasetProperties> listAllDatasetProperties();
List<DatasetProperties> listDatasetPropertiesForType( String schemaId );
List<String> listDatasetTypes();
boolean hasDataset( DatasetId id );
// initialize the repository connection
public boolean initializeConnection( Map<String, String> connection );
// delete a dataset
public boolean deleteDataset( DatasetProperties props );
// is repository read only?
public boolean isWritable();
Dataset
All dataset types in Bard must extend the AbstractDataset class. The methods of this class identify the basic pieces that define a dataset in Bard.
 // all dataset types must extend this abstract class
// returns globally unique id for this dataset
public DatasetId getDataId();
// get friendly name
public String getFriendlyName();
// set a friendly name
public void setFriendlyName( String friendlyName );
// returns the type id (e.g. schema id)
public String getTypeId();
// returns the metadata for this dataset.  Metadata is generally specified on the schema level
public Metadata getMetadata();
// get the data format (e.g. shapefile, table, etc)
public String getDataFormat();
RenderableDataset
The RenderableDataset type represents all datasets that can be rendered in a map view (e.g. raster, point/line/polygon shapefile, etc). These datasets contain Style information as well as geometry type. Two sub-classes of RenderableDataset are FeatureDataset and RasterDataset.
TableDataset
The TableDataset type represents tabular data that are in some standard format (e.g. tab delimited, comma delimited, etc). Typically, these datasets represent table inputs for analyses or output data that are not geocoded (e.g. Origin-Destination Table - input, Total System Travel Time - output).
DefaultSetDataset
The DefaultSetDataset type keeps track of a particular DefaultSet that contains the default parameters for a set of analyses that are saved as XML. Also tracked is the name of the default set and the date it was last modified. This is useful so that if a new version of the default set is available it can be retrieved.
ScenarioDataset
A ScenarioDataset contains the basic information about a scenario (e.g. friendly name, description, etc) and Scenario, all stored in XML so that scenarios can be saved and restored.
TextfilesDataset
The TextfilesDataset type was created to track generic text files that could be inputs to an analysis or outputs from an analysis and have no standard format (e.g. tab delimited, csv, etc). A concrete example of this is the MAEviz Temporary Housing Analysis, which has numerous text file outputs in a non-standard format that must be tracked. This class keeps a map of all file URIs that are part of the dataset.
MappingDataset
A MappingDataset contains a MatchFilterMap which is essentially a List of PropertyMatch where a property match contains a map of rules. The rules are used to map things such as fragility curves to buildings based on the rules that must be met. In this example, rules might include structure type, year the structure was built, foundation type, etc. This is useful when, in the case of fragilities, you have a plethora of possibilities and you need to filter by some criteria. Mapping datasets have other general case uses such as rules that return some value that will be used in an analysis (e.g. if a building meets certain rules, use a discount factor).
Schema
Each dataset type in MAEviz must have a schema assigned to it upon ingestion into the Data Catalog. The schema defines expected fields for dataset and the field type (e.g. string, integer, double, etc). It also provides a mechanism so that users can map their dataset field types to the expected types in the domain specific application. For example, in MAEviz a bridge dataset expects a class field; however, in the user's dataset the field name might be clazz. Instead of forcing the user to rename their dataset field, MAEviz will allow the user to inform it what field maps to class. Schemas enforce that required fields are present in the dataset so that the Analysis Manager knows which fields a dataset can feed into and what analyses can be run on particular datasets. To define a new dataset type, the user must extend the ncsa.gis.gisSchemas extension point and provide a .xsd file in their plugin defining the new data type. Preferably, this file should go into a folder in the plugin called gisSchemas so that it is consistent with the rest of Bard.
Metadata
The metadata in Bard 1.0 is limited to what is defined in an .xml file with the same file name as the corresponding .xsd file and should reside in a directory in the plugin called gisMetadata. These limited capabilities are going to be vastly expanded in version 2 of the Data Catalog, but this is what exists now. For example, if you have a schema called foo.xsd in the gisSchemas folder there should be a foo.xml in the gisMetadata folder. For more information about the dataset schemas and the metadata format and tags, see the following page:
Import
The Import wizard steps the user through the process of ingesting a dataset. Each schema has a generic format associated with it (e.g. shapefile, table, etc) and this is what the wizard will ask first: what is the format of your dataset? Based on the answer to that question, the wizards next page will display sub-options of that format type (e.g. building, bridge, etc). For instance, if a user selects shapefile as the format, the next wizard will then ask them to be more specific and select building, bridge, etc. If the selection requires mapping dataset fields, then the next page will be a mapping page. So, in the case of building as the type, the next page will present options to map the datasets fields to the expected fields. The last page will let the user enter a friendly name for the dataset, a repository to ingest it to and a version number for the dataset.
Export
In Bard 1.0, there are defined export types for each format type (e.g. shapefile, table, etc) and in all cases, the only requested information from the user is where to export the data and a file name, the factory will take care of the rest. In Bard 2.0, there will be more options defined through metadata that will allow Bard to more readily support additional/new formats as they are made available.
Scenario Manager
The ScenarioManager manages each Scenario that is created. The Scenario acts as a container for all things that are in the scenario including a list of datasets, region of interest information, name, description, which default set is associated with the scenario, etc. The ScenarioManager allows users to build multiple scenarios simultaneously so that many what-if type analyses can be executed and the results tracked on a scenario by scenario basis.
  // contains information about a scenario

// Set the region of interest
public void setRegionOfInterest(RegionOfInterest regionOfInterest);
// Realize the scenario (e.g. load data, etc)
public void realize();
public boolean hasDataset( Dataset dataset )
public boolean addDataset( Dataset ds, boolean addIfAlreadyExists ) throws DatasetAdditionException
public void addDataset( Dataset ds ) throws DatasetAdditionException
public void removeDataset( Dataset d )
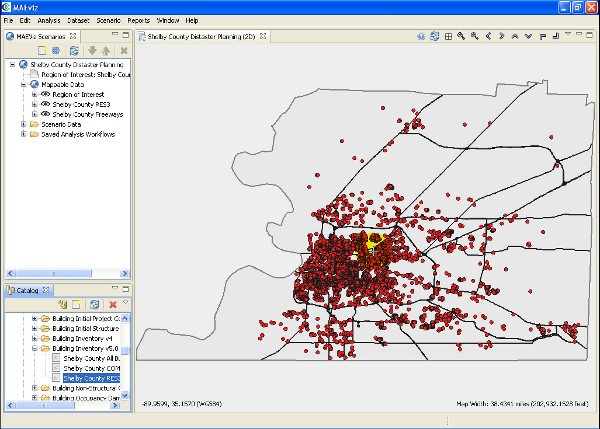
Map Renderer View
Each visualization view that is supported by Bard must extend the ncsa.gis.ui.gisRenderers extension point and extend the RendererBuilder base class. Some of the more important methods that each visualization view should provide are listed below.
 // an abstract class that all new visualization views should extend
// refresh the view
public void refresh();

// build the view given the parent composite
public Composite build(Composite parent);
// build the view given the parent composite and the specified layout
public Composite build(Composite parent, Layout layout);
// clean up the view and dispose of widgets
public void dispose();
Bard includes two concrete implementations that will be described in the next sections, one is a 2D view and the other is a 3D view.
2D View
The current 2D View is implemented using the GeoTools library. The GeoTools library contains a MapContext which contains all of the renderable layers. This container is used by both the 2D and 3D views since it contains generic drawing information that can be reused across the different rendering views. the MapContext contains List of type MapLayer where the map layer object holds the data source and style information. Thus, new rendering views have all the drawing information passed to them in the Map Context and simply need to implement the code to render the various objects (e.g. points, lines, polygons, etc).
3D View
The current 3D View is implemented using the Visualization Toolkit (VTK) library. VTK is a c++ library that supports several interpreted interfaces including Java. Using VTK, we have created several rendering pipelines for drawing points, lines, polygons, and raster data on a VTK Canvas as well as style adapters to take the GeoTools style information and apply it to the VTK objects.

Table View
The Table View in Bard is designed using the KTable, a custom SWT Table Widget. The Show Attribute Table option in the UI will only be available for datasets that implement ITabular. Based on the metadata for a dataset type, the table highlights result columns in a light shade of blue to distinguish them from the other columns. Additionally, the metadata provides friendly names for the field names. Since there is a character limit on field names the typical field name can be cryptic (e.g. APPR_BLDG is the building's appraised value). Other options in the Table View include showing statistical information for each field along with a chart of the data points in a Statistical View. The statistics generated for a column by KTable are:
- Count
- Maximum
- Mean
- Median
- Minimum
- Standard Deviation
- Sum

The image above is the statistics view for a bridge damage dataset where the graph is displaying the frequency of occurrence for the complete damage values. From the Table View, users can also export or public selected table rows, select rows by filter, configure visible columns, and copy selected cells so data can be transfered to another program for more post-processing.
Charting
Bard v1.0 uses JFreeChart to provide the graphing capabilities for each dataset type that can be graphed. The initial graph that is displayed when the option is selected for a dataset is based on the metadata defined for the dataset type. This graph is the same graph that is displayed in the default reports. After selecting the show chart option for a dataset, the user can change the data displayed in the chart as well as the chart type through the Change Chart Properties button. This will bring up a wizard similar to the one below:

The following chart types are currently supported:
- Stacked Bars
- Pie Chart
- Line Chart
- Bar Chart
After changing the chart settings, Bard will remember the settings used for a dataset type and use that from now on.
Each chart type available in the wizard is defined at the ncsa.gis.chart.chartType extension point. This extension point is available for developers/users to add support for additional graph types. By using this extension point the graphs are immediately available to the system since the graph wizard can discover new chart types from the specified extension point. There is also an ncsa.gis.chart.ChartDataAdapter extension point that provides access to the data for the charts. There are currently two chart data adapters in Bard, one for the table format and one for shapefile format. If new format types are added to the system that have data that can be graphed, a new adapter will be required.
Reporting
For general users, Bard offers two standard reports that are built into the system. They are the Default Detail Report and the Default Summary Report. These reports use the metadata associated with each data type to determine which fields to display in the various parts of the report. For users who want more control over reporting, there is a custom report editor that allows you to either build off of one of the standard reports or create one from available report elements. For developers/users who want even greater control, the ncsa.gis.reports.reportElements extension point allows you to add new report elements.
Select Report View
The image below is the summary report for a building damage dataset in Shelby County Tennessee. It includes an image of the map view, a graph of the most important attribute as specified by the metadata, and a table summarizing the results based on the summary type of each field as specified in the metadata.
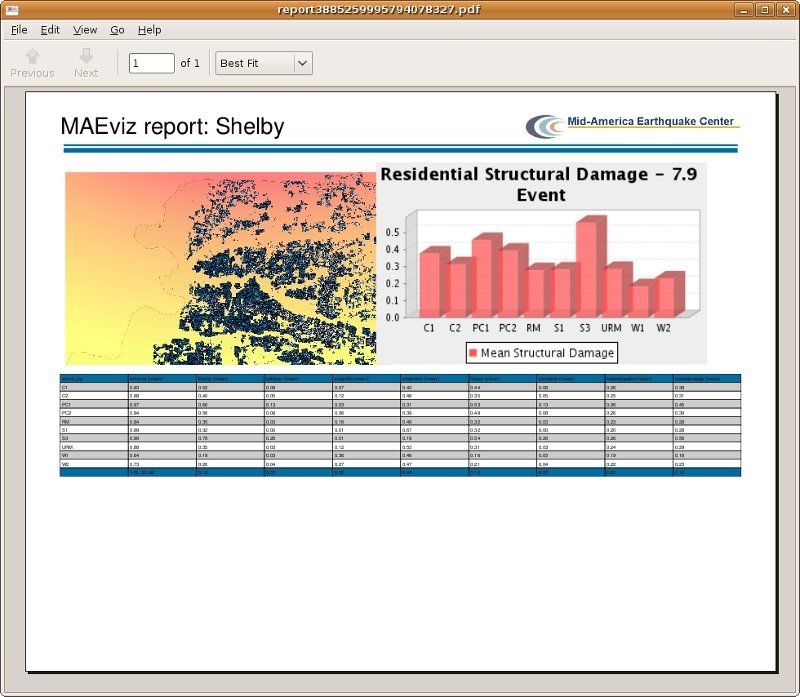
In this case, the summary field is the building structure type. The chart is also grouping the plotted field mean damage by structure type. These can be changed in using the Custom Report Editor and will be described in the next section.
Custom Report Editor
The image below is the custom report editor view where users can build custom reports from the available widgets in the right hand toolbox. This editor allows users to build and save report templates that can be re-used if the standard report templates do not suffice. Users can also create a new report starting from one of the standard reports and saving it under a new template name.

The report widgets available include:
- MaevizPageHeader - The MAEviz standard report header which will include the MAE Center logo.
- Image - Add an image to a report using the file browser. After clicking on a widget, the Report Element Properties View should open.
- Map Image - Add a Map Image to the report.
- Table - Add a Table to the report. After clicking on the widget, the properties view will open and you will need to select a scenario, the dataset type that should fill in the table, and the fields to include.
- Summary Table - Add a Summary Table to the report. Similar to a table, but with an additional selection that allows you to add a field to summarize the results by (e.g. show damage by building structure type).
- Chart - Add a chart to the report. Clicking on the chart widget will bring up the properties view allowing you to select the dataset type for the chart, the field to show on the x/y axis, etc.
- Text - Add a text widget to the report. Clicking on the text widget will bring up the properties view allowing you to add text to the report (e.g. notes).
- Divider - Add a divider widget to the report. This simply adds a thin divider to separate sections of the report.
Report Element Properties
This view allows users to supply input to the report elements. For example, in the case of the image element, it allows users to specify the image to use in the report.
An example of the image properties editor can be seen in the image below.

An example of the chart report properties editor.

An example of the table summary report properties editor.
