In this segment, we'll look at an adaptation of the stream benchmark to use dynamically allocated memory and analyze the code with valgrind via eclipse.
First, add the valgrind plugin to your eclipse installation: 
Then build the code (attached to this wiki page as stream.c ). Set it up as a new c project and add "-fopenmp" to the compile and link settings under the project properties if you want pthread/OpenMP support compiled in (we'll run it that way for the demo). 
After building the project, try profiling it with valgrind. There are a couple options to explore. The default is to check for memory leaks. 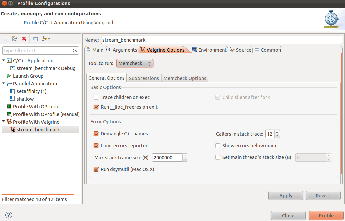
It's normal for valgrind to flag the pthread_create system call associated with the OpenMP directives. Try uncommenting one of the free() lines near the end of main() , rebuild and profile again. 
This time, notice valgrind has marked a line of the code with a malloc(). Since there's no corresponding free for that memory, valgrind throws an error. 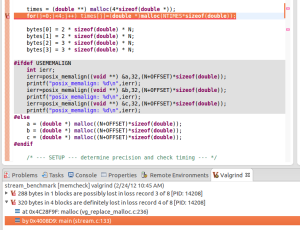
Switching to Valgrind's Massif tool, we can profile the memory use of the application over time for heap (default) and stack (if selected in the options). Also note that clicking on one of the data points in the massif plot will highlight that snapshot in the Valgrind table tab. 
The cachegrind tool can simulate how your application interacts with cache . A profile run with cachegrind will generate data for all of your application and the system calls required to support it. You'll typically find your application code's profile data toward the end of the list. Hover over the Location labels for detail on their meaning. Selecting a file->routine->line# in the Valgrind Cachegrind table will take you to that line in your source code. 
Valgrind's Helgrind utility for use with pthreads is also integrated into Eclipse. Not being a big pthread programming, I don't have much to say about it but it's interesting to take a look at an OpenMP code (like our test program) and see what Helgrind reports.
References: