The C3 AI Suite provides researchers many tools to analyze data and build and deploy machine learning models. To get started using the C3 AI Suite, please follow the C3.ai DTI Quickstart guide. This guide explains how to connect to a C3.ai cluster, access data using C3.ai methods, and convert C3.ai method outputs to an easy-to-analyze form. Additionally, the guide also provides more detailed instructions to DTI members using the Covid-19 DataLake. Examples in this guide work using the base Datalake available in the git repository: https://github.com/c3aidti/dtiTraining
Please note, this guide covers how to run read-only queries on the C3 AI Suite. For more advanced topics, such as loading data, building metrics, or configuring and training machine learning models, please refer to the following wikis:
- Data Integration (Not yet available)
- Metrics (Not yet available)
- Machine Learning (Not yet available)
Provision a C3 Package
Provision your C3 package to your C3 cluster/tenant/tag following the instructions available at the DTI Provisioning Guide. DTI members wishing to execute the examples in this guide should provision the 'baseCovidDataLake' using the special instructions in the guide.
Connect to a C3.ai cluster
There are several options to connect to a C3.ai Cluster:
- Python
- JS
Fetching Instances of Types
All data in the C3 AI Suite are stored in C3.ai Types.Users can access data from a C3.ai Type with the 'fetch' method. Behind the scenes, the 'fetch' method submits a query directly to the database underlying a C3.ai Type, and retrieves and presents query results to C3 AI Suite users.
The C3 AI Suite returns the 'fetch' query's response, which includes (1) data from the C3.ai Type itself; (2) Metadata for the 'fetch' query (e.g., the number of objects, whether additional data exists in the database) into the FetchResult type, for data analysis (see example below).
To learn more about the 'fetch' method, please see the following C3.ai Developer Documentation:
- Fetching and Filtering: https://developer.c3.ai/docs/7.12.0/topic/tutorial-fetching-and-filtering
- Fetch and Filter Basics: https://developer.c3.ai/docs/7.12.0/topic/console-data-exploration-fetch-and-filters
- Fetch and Filter Advanced: https://developer.c3.ai/docs/7.12.0/topic/console-fetch-and-filters-advanced
Users can also provide a FetchSpec (or parameters) to the 'fetch' method to describe particular data to retrieve (e.g., only retrieve gene sequences collected in Germany). The FetchSpec can be 'empty' (e.g., OutbreakLocation.fetch()), or contain several parameters to return a subset of the data.
Some example FetchSpec parameters include:
- filter: Filter expression to return a subset of the data (e.g., age <= 20). Filter expressions must evaluate to a Boolean type (i.e., true or false)
- limit: the maximum number of rows that should be returned. Be default, if no limit is specified, the C3 AI Suite returns 2,000 rows from the C3.ai Type. Specifying a limit is often helpful to debug a fetch 'method', without returning too many records.
- include: Specifies the particular fields from a C3.ai Type to return to the FetchResult. By default, if no include spec is defined, all fields from the C3.ai Type will be returned.
- order: Specifies the order to return the query's results (either "ascending" or "descending")
Note: Please see this C3.ai Developer Documentation for full list of FetchSpec parameters: https://developer.c3.ai/docs/7.12.17/type/FetchSpec
Examples of Fetch Calls
As an example, please see the DTI Housing Coverage Example here: https://github.com/c3aidti/HouseCoverageExample
In this example, the BlockInfo Type contains information aggregated about census blocks. We can fetch BlockInfo records, for which the 'prp_bf_lr' field exists (i.e., is not null). We can also retrieve these records in descending order by their 'id'.
BlockInfo.fetch({
	'limit': -1,
	'filter': 'exists(prp_bf_lr)',
	'order': 'descending(id)',
	'include': 'pct_i_l,pct_t_l,prp_res_lr,pop10_ha_lr,hu10_ha_lr,eroom_ha_lr,med10_age,prp_bf_lr',
})
You can run this same fetch in Python:
raw_data = c3.BlockInfo.fetch(spec={
    'limit': -1,
    'filter': 'exists(prp_bf_lr)',
    'order': 'descending(id)',
    'include': 'pct_i_l,pct_t_l,prp_res_lr,pop10_ha_lr,hu10_ha_lr,eroom_ha_lr,med10_age,prp_bf_lr'
})
Additional details on "Fetching in Python" are available in this C3.ai Developer Documentation: https://developer.c3.ai/docs/7.12.0/topic/ds-jupyter-notebooks
Additional examples of fetch calls can be found in our examples here:
- https://github.com/c3aidti/casesExample
- https://github.com/c3aidti/genomicsExample
- https://github.com/c3aidti/HouseCoverageExample
- https://github.com/c3aidti/VaccineListing
- https://github.com/c3aidti/EpidemiologyExample
The fetchCount Method
Another useful fetch command is fetchCount. This function is nearly identical to the fetch commands above, but it just returns the number of records which match the fetch filter. This is useful when trying to determine whether a given search is refined enough.
BlockInfo.fetchCount({'filter': 'exists(prp_bf_lr)'})
The same in python is:
c3.BlockInfo.fetchCount(spec={'filter': 'exists(prp_bf_lr)'})
Converting Fetch results to usable forms in Jupyter Notebook
When using a Jupyter Notebook, C3.ai developers typically modify FetchResults for data analysis. This section shows a couple ways to convert FetchResults into easy-to-analyze forms.
Python
In python, first, retrieve the 'objs' field from the FetchResults object, and then call the toJson() function. The toJson() function returns an array of dictionaries each with keys equal to the requested fields of the fetched C3.ai Type. Using the Pandas library, this array can be turned into an analysis-ready DataFrame, as the below example shows.
A Code Example in Jupyter Notebook:
## continue from above ##
import pandas as pd
df = pd.DataFrame(raw_data.objs.toJson())
df.head()
df.drop('meta', axis=1, inplace=True)
df.drop('type', axis=1, inplace=True)
df.drop('version', axis=1, inplace=True)
df.drop('id', axis=1, inplace=True)
df.head()
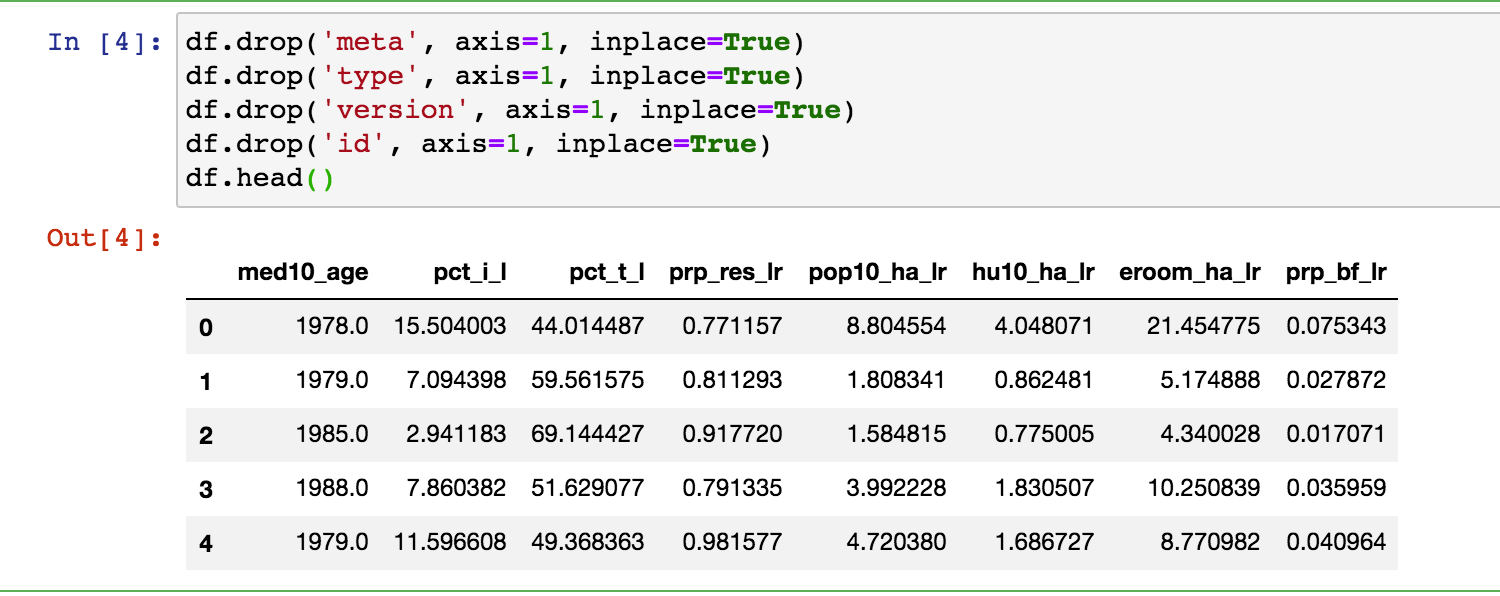
Users can then manipulate the resulting DataFrame, using common programming libraries and frameworks.
ExpressionEngineFunctions
The C3 AI Suite also provides a pre-built library of "ExpressionEngineFunctions". Expression EngineFunctions take a variety of arguments and perform various data processing tasks. For example, the function 'contains' takes two strings as arguments, and checks whether the first argument contains the second argument. The function 'lowerCase' takes as input a string, and returns that same string with all lowercase letters. In addition to these string processing functions, the C3 AI Suite's ExpressionEngine includes many math functions such as 'log', 'avg', and 'abs', which operate on a various input data types (e.g. int, double, float).
The ExpressionEngine Functions are used in several places such as:
- 'fetch filters
- simple and compound metric expressions
- tsDecl metric values
Please see this C3.ai Developer Documentation for a full list of the C3 AI Suite's ExpressionEngineFunctions: https://developer.c3.ai/docs/7.12.0/type/ExpressionEngineFunction
Developing Metrics on Timeseries data
The C3 AI Suite also offers several features to handle timseries data. To interact with timeseries C3.ai developers typically use simple and compound metrics. These metrics are used in several places in the C3 AI Suite such as:
- Alerts and Application Logic
- Machine Learning Features
- User Interface (to Visualize Data)
Simple Metrics
Simple metrics allow C3.ai developers to produce timeseries from raw data, and are often used to construct more advanced metrics (i.e., Compound Metrics), in practice. Simple metrics are linked to a specific C3.ai Type and reference the timeseries data stored within that C3.ai Type. To declare a simple metric, users should specify the following fields:
- id: simple metric's unique id, which should follow the convention "name_srcType" (e.g., Apple_DrivingMobility_OutbreakLocation)
- name: simple metric's name (e.g., Apple_DrivingMobility)
- description: simple metric's description (optional field)
- srcType: the C3.ai Type the simple metric is analyzed on (e.g., OutbreakLocation)
- path: path from the srcType to the C3.ai Type, that stores the raw data referenced by the simple metric (e.g., pointMeasurements) Note: if the srcType itself stores the raw data referenced by the simple metric, path field is optional.
- expression: the expression (or ExpressionEngineFunction) applied to the raw data, referenced by the simple metric (e.g., avg(avg(normalized.data.quantity)). Note: the "normalized" key term, instructs the simple metric to use normalized (instead of raw) data on the C3 AI Suite (to learn more about Normalization, see this C3.ai Developer Documentation: https://developer.c3.ai/docs/7.12.17/topic/normalization )
Here is an example of a Simple Metric:
sample_met = c3.SimpleMetric({
	'id': 'SampleMetric_SampleType',
	'name': 'SampleMetric',
	'srcType': 'SampleType',
	'path': 'timeseriesValues',
	'expression': 'avg(avg(normalized.data.x))'
})
To learn more about Simple Metrics, please see the C3.ai Developer Documentation here:
https://developer.c3.ai/docs/7.12.17/topic/tutorial-simple-metrics
- https://developer.c3.ai/docs/7.12.17/topic/metrics-simple-metrics
Another type of SimpleMetric is a tsDecl (Timeseries Declaration) metric. tsDecl metrics are often used to turn non-timeseries raw data (e.g., event data, status data, or data with irregular intervals) into timeseries. tsDecl metrics have the same fields as standard SimpleMetric, except for the 'tsDecl' field, which replaces the 'expression' field. tsDecl metrics may allow users the added flexibility to define new metrics which the expression field may not support. Using a tsDecl metric, the above metric can be re-written as:
sample_met = c3.SimpleMetric({
	'id': 'SampleMetric_SampleType',
	'name': 'SampleMetric',
	'srcType': 'SampleType',
	'path': 'timeseriesValues',
	'tsDecl': {
		'data': 'data',
		'treatment': 'AVERAGE',
		'start': 'start',
		'value': 'value'
	}
})
Please note that the above examples do not have an example context in which they work. This will be updated soon with a version backed up by a working exercise.
To learn more about tsDecl metrics, please see the C3.ai Developer Documentation here:
- https://developer.c3.ai/docs/7.12.17/topic/metrics-tsdecl-metrics
- https://developer.c3.ai/docs/7.12.17/topic/tutorial-tsdecl-metrics
Compound Metrics
Compound metrics allow C3.ai developers to manipulate or combine existing metrics into more complex timeseries. Compound metrics are built on top of one or many existing Simple or Compound metrics. Please note, to evaluate a Compound metric on a C3.ai Type, all Simple metrics, used in that Compound metric, must be defined on that C3.ai Type, as well. Otherwise, an error is returned.
To declare a compound metric, users should specify the following fields:
- 'id': compound metric's unique id, typically the same as 'name' (e.g., BLS_UnemploymentRate)
- 'name': compound metric's name (e.g., BLS_UnemploymentRate)
- description: compound metric's description (optional field)
- expression: the expression (or ExpressionEngineFunction) applied to the metrics underlying the Compound metric (e.g., "BLS_LaborForcePopulation ? 100 * BLS_UnemployedPopulation / BLS_LaborForcePopulation: null")
An example CompoundMetric is:
sample_compound_met = c3.CompoundMetric({
	'id': 'CompoundMetric',
	'name': 'CompoundMetric',
	'expression': 'window("AVG", SimpleMetric, 0, 7)',
})
Please note, the above example is not tied to any sample exercises or hands-on tutorials. Sample exercises and hands-on tutorials will be added to this Wiki shortly.
To learn more about Compound metrics, please see the C3.ai Developer Documentation here:
- https://developer.c3.ai/docs/7.12.17/topic/metrics-compound-metrics
- https://developer.c3.ai/docs/7.12.17/topic/tutorial-compound-metrics
Finding, Evaluating, and Visualizing Metrics
Users can evaluate & visualize metrics built in the C3 AI Suite, via the JavaScript console or a hosted Jupyter notebook.
Finding Metrics
All metrics that users build and deploy in the C3 AI Suite are also stored in C3.ai Types. To view a list of all the simple and compound metrics applicable to a C3.ai Type, run the 'listMetrics' method, as shown below:
Javascript:
var metrics = SmartBulb.listMetrics()
c3Grid(metrics)
Python:
pd.DataFrame(c3.SmartBulb.listMetrics().toJson())
DTI Members using the Covid-19 DataLake: While listMetrics does return a list, this is fairly bare bones if the 'description' field of a given metric isn't filled in. The Covid-19 DataLake API documentation provides an extensive list of production-ready metrics along with detailed descriptions and usage examples. Please see that documentation here: https://c3.ai/covid-19-api-documentation/
After finding a metric, the next step is to evaluate on data in a C3.ai Type.
Evaluating Metrics
Metrics are evaluated with either the 'evalMetrics' or 'evalMetricsWithMetadata' methods. Behind the scenes, 'evalMetrics' and 'evalMetricsWithMetadata', fetch and transform raw data from a C3.ai Type into easy-to-analyze timeseries data. 'evalMetrics' is used to evaluate metrics provisioned (deployed) to a C3.ai tenant/tag. 'evalMetricsWithMetadata' allows users to evaluate metrics either provisioned to a C3.ai tenant/tag or defined on-the-fly in JavaScript console or a hosted Jupyter notebook (typically for debugging).
To learn more about the differences between 'evalMetrics' and 'evalMetricsWithMetadata' see the C3.ai Developer Documentation here: https://developer.c3.ai/docs/7.12.0/type/MetricEvaluatable
To evaluate a metric, users must provide the following parameters (called an EvalMetricSpec) to the 'evalMetrics' or 'evalMetricsWithMetadata' methods.
- ids ([string]): A list of ids in the C3.ai Type, on which you want to evaluate the metrics (e.g., "Germany", "California_UnitedStates")
- expressions ([string]): A list of metrics to evaluate (e.g., "JHU_ConfirmedCases", "Apple_DrivingMobility")
- start (datetime): Start datetime of the time range to be evaluated (in ISO 8601 format) (e.g., "2020-01-01")
- end (datetime): End datetime of the time range to be evaluated (in ISO 8601 format) (e.g., "2020-08-01")
- interval (string): Desired interval for the resulting timeseries data (e.g., MINUTE, HOUR, DAY, MONTH, YEAR)
Here's an example of evaluating a metric in Python:
spec = c3.EvalMetricsSpec({
	'ids': [ 'A', 'B', 'C' ],
	'expressions': [ 'SampleMetric', 'SampleMetric2' ],
	'start': '2019-01-01',
	'end': '2019-05-01',
	'interval': 'DAY',
})

results = c3.SampleType.evalMetrics(spec=spec)
The C3 AI Suite returns the evaluated metric results (a timeseries) into the 'EvalMetricsResult' type. With various helper functions, C3.ai developers may then convert this timeseries into a Pandas DataFrame (via "Dataset" type) for further data analysis or model development in a Jupyter notebook, as shown below.
ds = c3.Dataset.fromEvalMetricsResult(result=results)
df = c3.Dataset.toPandas(dataset=ds)
Additionally, users can visualize evaluated metric results directly in the web-browser (i.e., JavaScript console) with the 'c3Viz' function.
Here's an example of evaluating and visualizing in JavaScript console.
var spec = EvalMetricsSpec(
	ids= ['A', 'B', 'C' ],
	expressions= [ 'SampleMetric', 'SampleMetric2' ],
	start= '2019-01-01',
	end= '2019-05-01',
	interval= 'DAY')

var results = SampleType.evalMetrics(spec)
c3Viz(results)
To learn more about evaluating and visualizing metrics, please see the C3.ai Developer Documentation here:
- https://developer.c3.ai/docs/7.12.17/topic/metrics-evaluating-metrics
- https://developer.c3.ai/docs/7.12.17/topic/metrics-visualizing-metrics
- https://developer.c3.ai/docs/7.12.0/topic/ds-jupyter-notebooks
Note: Metrics can only be evaluated on C3.ai Types that mix in the 'MetricEvaluatable' Type.
Conclusion
Official C3.ai Developer Documentation:
- Timeseries Normalization: https://developer.c3.ai/docs/7.12.0/guide/guide-c3aisuite-basic/ts-normalization-engine
- Timeseries Treatments: https://developer.c3.ai/docs/7.12.0/guide/guide-c3aisuite-basic/ts-treatments-home
- Timeseries Metrics:https://developer.c3.ai/docs/7.12.0/guide/guide-c3aisuite-basic/metrics-home
- Simple Metrics: https://developer.c3.ai/docs/7.12.0/guide/guide-c3aisuite-basic/metrics-simple-metrics
- Compound Metrics: https://developer.c3.ai/docs/7.12.0/guide/guide-c3aisuite-basic/metrics-compound-metrics
Review and Next Steps
In most data analysis, C3.ai developers run the 'fetch' and 'evalMetrics' methods. This C3.ai DTI Quickstart guide provides an introduction to these methods, in which the C3 AI Suite is used as a read-only database, accessed via APIs. In the following guides, you will learn how to run 'write' operations on the C3 AI Suite such as:
- Defining new types
- Loading new data
- Clean-up databases in your tag
- Train machine learning models
- And so on..
Welcome to the start of your experience with the C3 AI Suite.