The C3.ai system contains many tools to help scientists with their data analysis. We want researchers
to have the option to get started using C3 right away. This guide details how to connect to a C3 cluster,
fetch data you want to use, and convert it into a form that you can more easily analyze.
This guide serves as a starting point for your C3 journey, but does not expose most of C3's API or potential.
Connecting to a C3 Cluster
There are a couple options for connecting to the C3 Cluster:
- Python
- JS
Fetching Instances of Types
All data in C3 is represented by a 'Type'. Data for a specific type can be 'fetched' from C3 using the 'fetch' API.
In each language, each Type has a 'fetch' function to which a FetchSpec Type can be passed. This function then retrieves
the data in a FetchResult Type which can be opened and used for data analysis.
Fetching is governed by the FetchSpec Type and you can find full documentation of that type here. However,
as a simple API description, may not be particularly helpful at first. Generally, the FetchSpec type defines a set of
constraints to apply when gathering Type data. it can be 'empty' i.e. without constraints, but generally you'll
want to apply one or more to get reasonable results.
The most useful properties of the FetchSpec are:
- filter: Defines an expression to evaluate for each type. When the expression evaluates as true, that type is fetched.
- limit: Fetch only 'limit' results. Can be useful to debug a fetch which might grab a lot of results.
- include: Define specific properties of the Type to include in the fetch result. If not defined, all properties will be grabbed.
- order: An expression which defines the order to return the results in.
Examples of Fetch operations
Consider the DTI housing example located here: https://github.com/c3aidti/HouseCoverageExample
In this example, the Type BlockInfo defines information aggregated about census blocks. We can for example, fetch BlockInfo
types for which the 'prp_bf_lr' property is defined. Then we can order them based on their 'id' properly.
BlockInfo.fetch({
	'limit': -1,
	'filter': 'exists(prp_bf_lr)',
	'order': 'descending(id)',
	'include': 'pct_i_l,pct_t_l,prp_res_lr,pop10_ha_lr,hu10_ha_lr,eroom_ha_lr,med10_age,prp_bf_lr',
})
Here's how you would perform the same fetch in python:
raw_data = c3.BlockInfo.fetch(spec={
    'limit': -1,
    'filter': 'exists(prp_bf_lr)',
    'order': 'descending(id)',
    'include': 'pct_i_l,pct_t_l,prp_res_lr,pop10_ha_lr,hu10_ha_lr,eroom_ha_lr,med10_age,prp_bf_lr'
})
More examples of fetch commands can be found in our examples here:
- https://github.com/c3aidti/casesExample
- https://github.com/c3aidti/genomicsExample
- https://github.com/c3aidti/HouseCoverageExample
- https://github.com/c3aidti/VaccineListing
- https://github.com/c3aidti/EpidemiologyExample
Here is a list of C3 documentation mentioning fetching:
- FetchSpec Documentation: https://developer.c3.ai/docs/7.12.0/type/FetchSpec
- Fetching in Python: https://developer.c3.ai/docs/7.12.0/topic/ds-jupyter-notebooks
Converting Fetch results to usable forms in Jupyter Notebook
For most data analysis situations, FetchResults need to be massaged a little bit to be useful.
Here, we show the typical ways FetchResults can be used.
Python
In python, generally, you get the 'objs' property from the FetchResults object, then call the toJson() function.
This function returns an array of dictionaries each with keys equal to the requested properties of the fetched
type. This works well with the pandas DataFrame constructor which accepts such an array. The returned
DataFrame object can now be analyzed very easily. We show an example below.
A Code Example in Jupyter Notebook:
## continue from above ##
import pandas as pd
df = pd.DataFrame(raw_data.objs.toJson())
df.head()
df.drop('meta', axis=1, inplace=True)
df.drop('type', axis=1, inplace=True)
df.drop('version', axis=1, inplace=True)
df.drop('id', axis=1, inplace=True)
df.head()
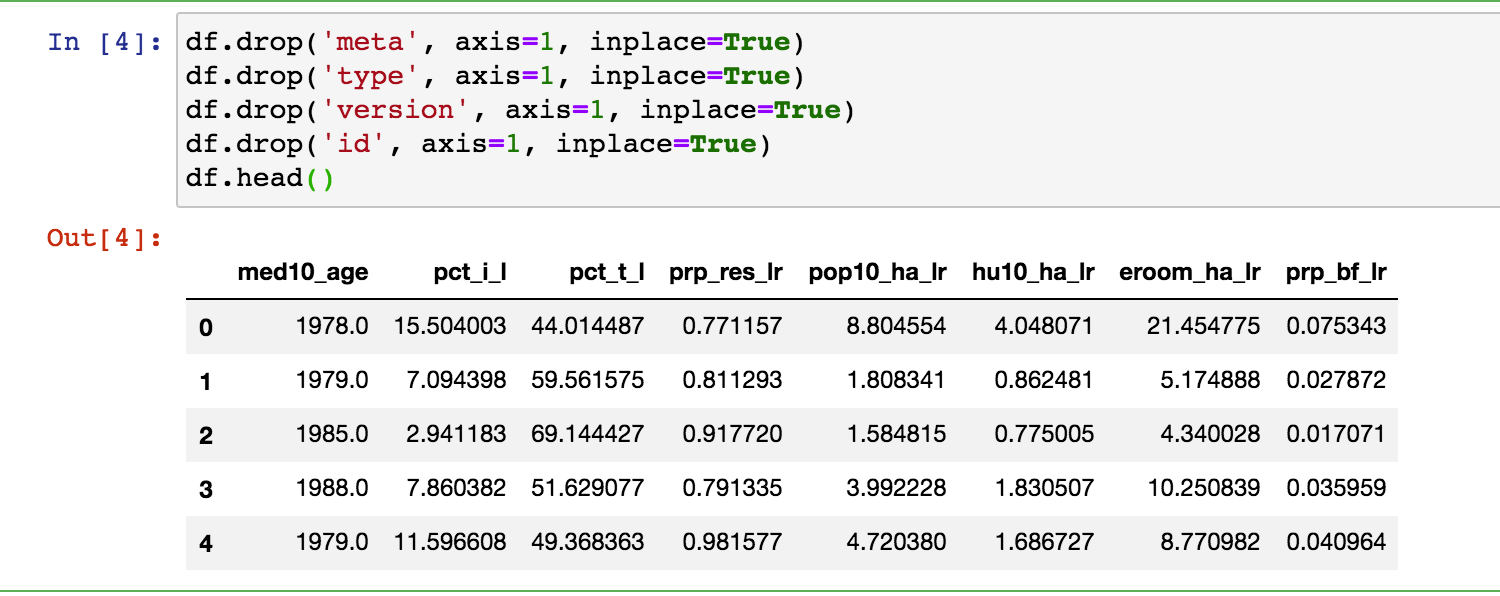
Users can then use the resulting dataframe as they normally would.
ExpressionEngineFunctions
Several spots in the C3 API allow for the use of so-called 'ExpressionEngineFunctions'. These functions take a variety of
arguments and perform a variety of processing tasks. For example, the function 'contains' takes two strings and checks
whether the first argument contains the second argument. The function 'lowerCase' takes an input string, and returns
that string with all uppercase letters replaced with lowercase ones. In addition to those string processing functions,
many math functions exist as well such as 'log' which operates on a variety of input data types.
These functions are very helpful, and can be used in a number of places such as:
- 'filter' field of FetchSpec
- 'expression' field of ComplexMetric
Official C3 documentation for ExpressionEngineFunctions: https://developer.c3.ai/docs/7.12.0/type/ExpressionEngineFunction
Evaluating Metrics on Time series data
C3 can store timeseries data using many different types, however knowing the exact type of timeseries data isn't
super important when it comes to evaluating so-called 'Metrics' on that data.
Normalization Process
Usually, timeseries data goes through a 'normalization' process, the purpose of which is to take non-uniform, and possibly multiple datasets and produce
a single uniform timeseries which can be analyzed a little more easily in most cases. We copy here the list of normalization steps that are currently
performed within the C3 platform, these are available from C3's official documentation here: https://developer.c3.ai/docs/7.12.0/guide/guide-c3aisuite-basic/ts-normalization-engine
- Drop data points with irregular dates. For example, dates where start date is after end date, dates are > 50 years apart, etc.
- Remove duplicate data points that might have been sent due to data loading issues or issues with IoT sensor hardware.
- Correctly apportion the values in the correct time interval in case of overlapping data points.
- Convert data points in various units into a homogenous unit utilizing C3's unit conversion capabilities.
- Automatic detection of the natural frequency of the data.
- Aggregate or disaggregate data into coarse or finer intervals to optimize for storage and accuracy.
Once the normalization process is complete, a single time series sampled at a uniform interval is given.
SimpleMetrics
Simple metrics form the 'base' of the Metrics system. They are defined on a specific Type and reference timeseries data stored within.
Essentially, the Simple metric defines:
- The Type on which the metric is defined
- How to find the timeseries data on the Type
- Configuration of the Normalization engine
- The name of the metric
An example SimpleMetric is:
sample_met = c3.SimpleMetric.make({
	'id': 'SampleMetric_SampleType',
	'name': 'SampleMetric',
	'srcType': 'SampleType',
	'path': 'timeseriesValues',
	'expression': 'avg(avg(normalized.data.x))'
})
Please note that the above example does not have an example context in which it will work. This will be updated soon with a version backed up by a working exercise.
For more detail, see the C3 documentation on SimpleMetrics here: https://developer.c3.ai/docs/7.12.0/guide/guide-c3aisuite-basic/metrics-simple-metrics
CompoundMetrics
Compound metrics are generally easier to define and use as they operate on already defined metrics either Simple or Compound.
They essentially just consist of and id/name, and an expression defining the metric in terms of constants and already defined metrics.
If you try and execute a CompoundMetric on a type for which some necessary SimpleMetric is not defined, you'll get an error.
Essentially, a CompoundMetric defines:
- The name/id of the metric
- The expression defining the metric
An example CompoundMetric is:
sample_compound_met = c3.SimpleMetric.make({
	'id': 'CompoundMetric',
	'name': 'CompoundMetric',
	'expression': 'window("AVG", SimpleMetric, 0, 7)',
})
Please note that the above example does not have an example context in which it will work. This will be updated soon with a version backed up by a working exercise.
For more detail, see the C3 documentation on CompoundMetrics here: https://developer.c3.ai/docs/7.12.0/guide/guide-c3aisuite-basic/metrics-compound-metrics
Evaluating Metrics
Not all SimpleMetrics are defined on all types. Types on which you can evaluate a metric mixin the Type 'MetricEvaluatable' (C3 Docs here: https://developer.c3.ai/docs/7.12.0/type/MetricEvaluatable)
This bestows the function 'listMetrics' to that type, so if you're unsure what kind of metrics are available for a given type, execute that function to get a list, for example:
var metrics = SmartBulb.listMetrics()
c3Grid(metrics)
pd.DataFrame(c3.SmartBulb.listMetrics().toJson())
Once you have the metric you want to evaluate in mind, you
Conclusion
To get started quickly, focus on 'CompoundMetrics'. They're the easiest to use, and for most cases, the 'AVG' treatment works well.
Official C3 documentation:
- Timeseries Normalization: https://developer.c3.ai/docs/7.12.0/guide/guide-c3aisuite-basic/ts-normalization-engine
- Timeseries Treatments: https://developer.c3.ai/docs/7.12.0/guide/guide-c3aisuite-basic/ts-treatments-home
- Timeseries metrics:https://developer.c3.ai/docs/7.12.0/guide/guide-c3aisuite-basic/metrics-home
- SimpleMetrics: https://developer.c3.ai/docs/7.12.0/guide/guide-c3aisuite-basic/metrics-simple-metrics
- CompoundMetrics: https://developer.c3.ai/docs/7.12.0/guide/guide-c3aisuite-basic/metrics-compound-metrics
Review and Next Steps
Principals from this Primer are