...
- Bring up the Run Analysis Wizard again and expand the Decision Support category and select Individual Utility Analysis. Click the Finish button. When the analysis graph is displayed, click on the Individual Utility Analysis block in the graph and you should see the form page appear.
- Some of the data we have already so we can fill that in. For Result Name, I suggest using something like Buildings - Incremental Utility For Retrofits.
- For the As-Built Decision Attributes field, select the dataset we already created from the drop down menu.
- You will notice that the Upgraded Decision Attributes Results field allows multiple inputs. This is because users might want to create a dataset with all low-code upgrades, all moderate-code upgrades and all high-code upgrades to see which upgrade gives the best return on investment. There might be a minor difference between as-built and low-code, but a more significant difference when upgrade to moderate-code. This would not be obvious unless you do all retrofit levels. For simplicity, we will only do a single upgrade to low-code since the user would only need to repeat the process we outline in the next few steps.
- Click on the Create button (
 ) next to the Upgraded Decision Attributes Results field. This will add a Building Decision Support Attributes box to the graph view. Click on it to bring up its form page.
 - For Result Name, use something like Low-Code Decision Attributes, for the non-structural damage, we can re-use the previously created non-structural damage because reinforcing the structure does not effect the non-structural damage. We can also select the previous retrofit cost estimation dataset. For the Attribute Selection, select the same attributes as you did for the as-built decision attributes so we have homogeneous datasets. For the population estimate, choose the same as previous (in our case we chose the Crude Population Estimate). If you made any other changes for the as-built decision attributes, make the same selections again. Finally, we need the new building damage after low-code upgrade so click on the Create button ( ) next to the Structural Damage field and click on the Building Structural Damage box to bring up the form page.
- For the Result Name field, choose something like Low-Code Structural Damage. For the Buildings field, choose the previously loaded building dataset. For the Hazard field, click on the Search button (
 ) and locate the scenario earthquake we already created.
 - Next, click on the Optional tab. In the Retrofit Cost Estimation field, choose the previously created retrofit cost dataset. This should populate a new field. Click on the Select Retrofits and select setAllTo. This should bring up a dialog box with the available retrofits, select Low Code Retrofit and click OK. Note: only the buildings with low-code available as a retrofit will be changed in the form page. Some buildings either don't have a low code retrofit fragility or are already considered low-code buildings. In these cases, the as-built fragility will be used so there will be no change in utility.
- At this point the analysis is ready to go. If you made any other changes to any of the form pages when computing the as-built decision support attributes, make sure those same selections have been made now so that we have homogeneous datasets. Click the Execute button. It may take some time to finish this analysis depending on the size of your dataset since each building is being changed one at a time to see the change in utility.
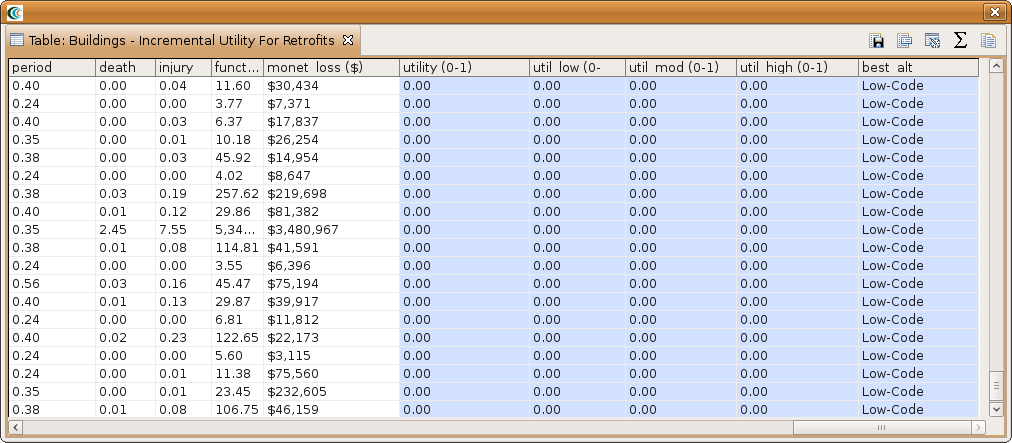
After the analysis finishes, you will have 5 additional columns. The utility column has the as-built utility value for the non-retrofit scheme. Following that are 3 columns, util_low, util_mod and util_high, which gives the change in utility if the building is upgraded to low code, to moderate code and to high code. The last column lists the best alternative based on the 3 utility values. For this to be useful we would have needed to do decision support attributes for moderate code and high code. You should see an attribute table similar to the one below if you used the settings we did
Analyzing Results
Now that the analyses that we were interested in have been completed, it's time to analyze and try to make sense of the results. There are various ways of viewing and visualizing the results, which we will learn now.
...