...
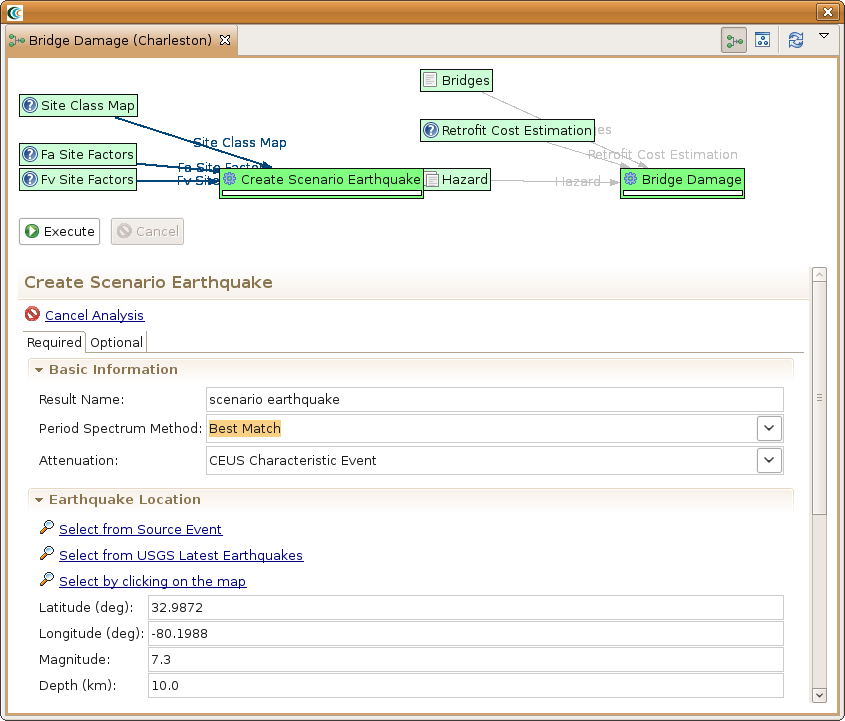
- For our hazard, we want to create a deterministic earthquake hazard. So this time, use the Create button to add a scenario earthquake analysis node to the graph. Click on the Create Scenario Earthquake box and you should see a form similar to the bridge damage analysis form. You will need to fill in a result name and select CEUS Characteristic event for the Attenuation. Under Earthquake Location, enter 32.9872 for latitude, -80.1988 for longitude, 7.3 for magnitude and 10.0 for depth. The rest can be left with the default values. See figure below.
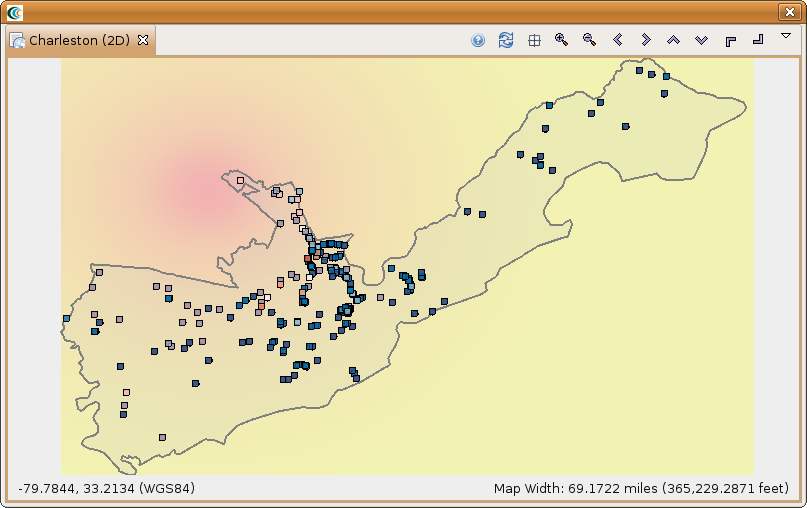
- After doing this, both the Create Scenario Earthquake box and the Bridge Damage box should have turned green. Click the Execute button. Alternatively, we could have clicked the optional tab on the bridge damage analysis form and selected to apply some retrofits. By default, MAEviz will use the as-built fragility for each bridge unless we specify to use retrofit fragilities in the optional tab. Once the progress bars have finished for each analysis, you should see new datasets added to your Scenario View and map: a Bridge Damage dataset which will contain the damage information, and the earthquake hazard dataset. Your Visualization should now look similar to the figure below with the bridges colored by mean damage.