NCSA wiki will be offline Friday, Apr 19, 2024, from 1600 hours until Sun, Apr 21, 2024 in order to upgrade Confluence.
Executive Summary
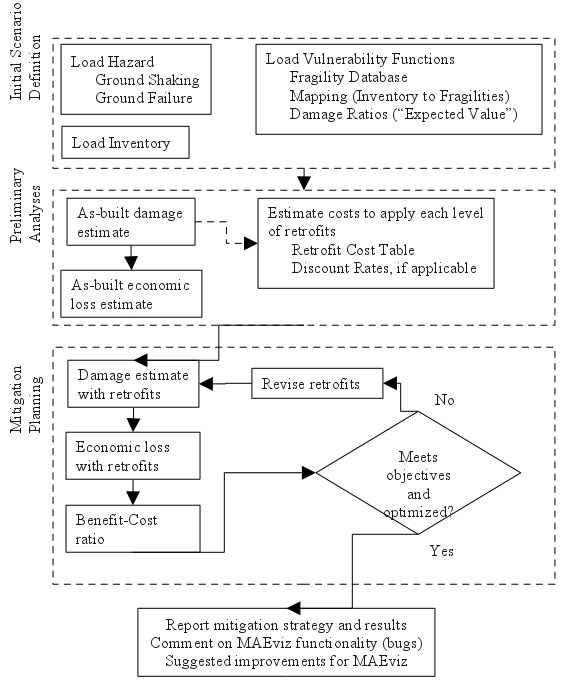
The following pages will give you an introduction to MAEviz. First, we will start with a short description of the layout of the program which will help you get familiar with the work environment before you start using MAEviz. We will follow that with a tutorial where you'll be able to run an earthquake risk assessment analysis. The purpose of this tutorial is to help you feel comfortable using the program and to also give you a clear idea of what MAEviz can do. The last part covers a user's guide where you can find a more extensive explanation of MAEviz capabilities that were not covered on the tutorial.
Exercise Overview
MAEviz Overview
Welcome
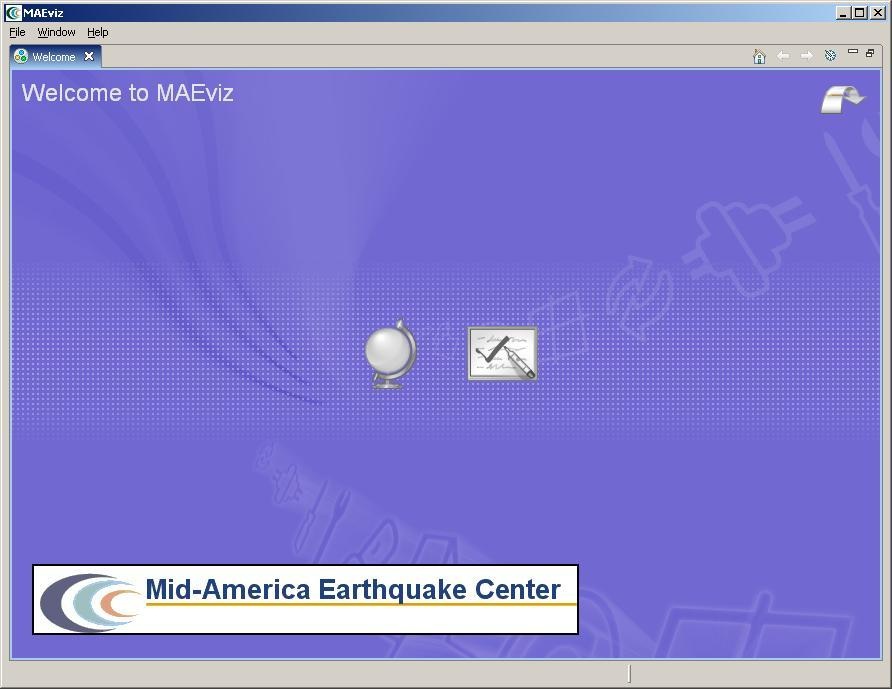
When MAEviz is first launched, the welcome screen appears. From the welcome screen, users can select to read an overview of information about MAEviz, follow built-in tutorials, or just begin working in MAEviz (by selecting Workbench which will take you to the main MAEviz screen, also known as the Workbench). See figure above.
Workbench Layout
The MAEviz workbench consists of a number of Views, each containing information about a specific part of MAEviz. Each view is like a sub-window within the MAEviz workbench window, and can be minimized, maximized, moved, or even torn away from the main window into its own window. These interactions are done by clicking the minimize and maximize view icons in the view's title bar, or by clicking and dragging on the view's border or title bar.
See the image below for the most commonly used views in MAEviz.
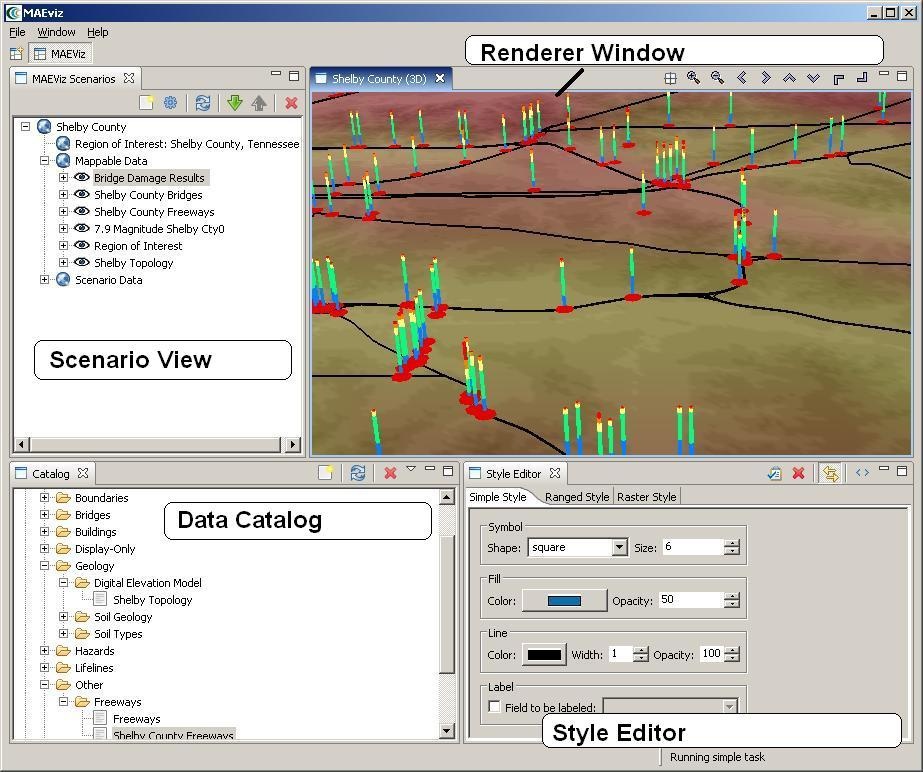
Scenario View
The Scenario View is where you will find a list of all the data for the scenario or scenarios that you are currently working with. Each scenario that you are working with is listed as a top-level item in this view, which can be expanded by clicking the plus ![]() icon next to its name, to see the details of the scenario. Inside each scenario, you can see a list of the Mappable Data and Scenario Data. All data listed in Mappable Data are the layers of data that appear in your rendered map whereas all the data listed in the Scenario Data includes all non-renderable data for the scenario (e.g. tables).
icon next to its name, to see the details of the scenario. Inside each scenario, you can see a list of the Mappable Data and Scenario Data. All data listed in Mappable Data are the layers of data that appear in your rendered map whereas all the data listed in the Scenario Data includes all non-renderable data for the scenario (e.g. tables).
The Scenario View is also where you would go to do the major operations on your scenarios: adding an earthquake hazard or other data, running damage analyses, etc.
Visualization View
The Visualization Window Views are where the rendered maps of your scenario will appear. Each scenario can have its own rendered 2d and 3d map, so you can see the visualization multiple scenarios simultaneously if desired. It is here that you can get a quick visual overview of the results of your analyses. You can control the camera position by using the mouse, or click the view control buttons in the toolbar.
Data Catalog View
The Catalog View is a list of all the data that is available for you to use in your scenarios. It is organized first by repositories, which are stores of MAEviz data. Repositories can represent local data, or data stored on a remote server. Within each repository, the data is organized by the type of data that it is. To add data to a scenario, you can navigate to and find the data within this view, then drag it into either the Visualization View for your scenario, or onto the scenario's name in the Scenario View. Before data can be made available to your scenario, it must be ingested into a repository and assigned a type. You can find instructions on ingesting building data here.
Style Editor View
The Style Editor is used to adjust the way in which a layer of data is displayed in the Visualization View. If the Style Editor is not visible, you can show it by right clicking a Mappable Data layer in the Scenario View, and selecting Change Layer Style. Once this view is showing, you can adjust the color, shape, opacity, and other display characteristics of the map layer. To apply your style changes, you must click the Apply button (  ) in the view's toolbar.
Other Views
Although these are some of the main views you will use, there are a few other views that are shown at various times while using MAEviz and we'll discuss them below.
Table View
The Table View is used to display tabular data such as the attributes of a set of inventory data or analysis results. The most common way to see this view is by right-clicking a Mappable Data layer in the Scenarios View and selecting Show Attribute Table.
Reports View
By right-clicking on a scenario name in the Scenarios View, and selecting Reports..., you can access the Select Report View. By default there are two report types available for every result based on the metadata for each result type, the Default Summary Report and Default Detail Report. The summary report will provide a summary of results and the detail report will provide explicit detail about each result (e.g. building by building results). To run a report, select the report you wish to run, right-click on it and select the Run Report option. The selected report will be generated and displayed. From that point, you can choose to print or save the report.
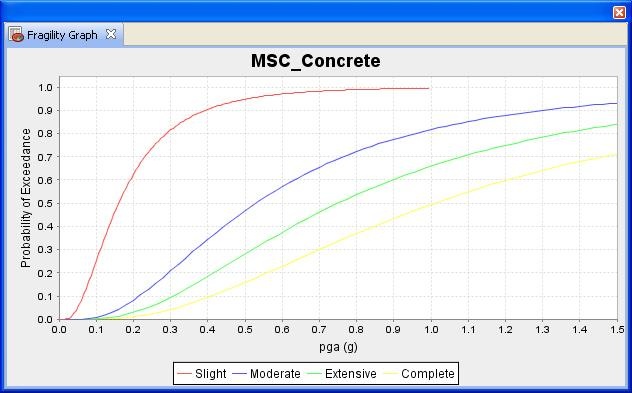
Fragility View
If you right-click a fragility dataset from the Catalog View, you can select View Fragility to access the Fragility View. The Fragility View shows a list of fragility types that you can drill down into to select and view a particular fragility curve. When you have found the fragility curve that you want to view, right-click it and select View Fragility Set to view a graph of the fragility curve. See the image below.
MAEviz Tutorial
The tutorial covers the typical steps that will be needed in order to perform an earthquake risk assessment. Here are the steps:
- Create a New Scenario
- View the Scenario and Add Data
- Running an Analysis
- Analyzing the Results
Example Scenario
In this demonstration, we will use MAEviz as a specific stakeholder would use the tool. The South Carolina DOT has contracted with your group to perform a seismic risk assessment of the transportation network in Charleston South Carolina. Using recently developed bridge fragility curves, and damage-functionality relationships for bridges, you are to perform an analysis of the approximately 340 bridges in the region. The bridge fragility curves are developed for 9 classes of bridges, which cover over 90 percent of the bridge inventory in Charleston. The Hazard which will be evaluated is a magnitude 7.3 earthquake near Charleston (Summerville).
In the process, we will see how the Emergency Manager will launch the MAEviz application, load the GIS data for Charleston County, and then generate earthquake hazard information based on the scenario he wants to investigate. After he has loaded this base information, he can interactively choose and display information for the specific items he wants to evaluate - the bridges, as well as load fragility information about these particular structures. From there, we will witness an analysis of the impact of the hazard. This analysis will assist the stakeholder in evaluating the impact of the damage to the transportation network and consequently, emergency routes. These factors have important social and economic impacts.
Creating a New Scenario
- When you start MAEviz and if this is the first time you have run MAEviz, you will be shown the welcome screen. To begin working with MAEviz, click the rightmost icon (
 ) which will take you directly to the MAEviz workbench.
 - From the application's menu bar, click File -> New Scenario. Alternatively, you can click the New Scenario button (
 ) from the Scenario View's tool bar
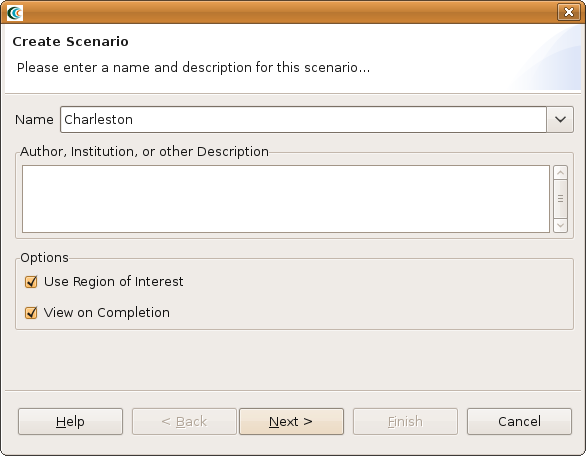
 - The New Scenario Wizard will now be showing. This is where you define the scenario that you would like to work with. Enter a name for your scenario, such as "Charleston", and then optionally enter any descriptive information about the scenario in the large text box. Click the Next button. See the figure below.
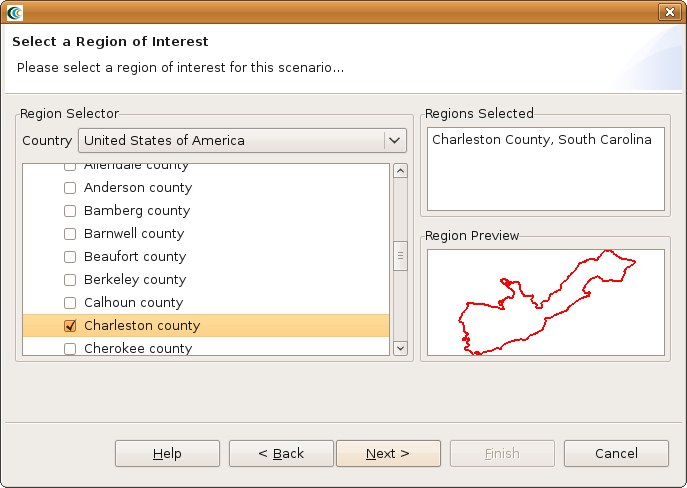
- At this point, you will be selecting the region of interest that you would like to work with. We will be analyzing Charleston, SC, so select United States of America from the Country menu. You should see a list of states appear in alphabetical order. Scroll down to find the state of Tennessee and click the
 symbol next to South Carolina. You will now see a list of counties displayed. Scroll down to find Charleston and click the box so that a check appears next to the name. You should now see Charleston, South Carolina populate the Regions Selected box. This new region of interest wizard allows you to add multiple regions of interest by checking other boxes of regions you want to use; however, for this tutorial we will only focus on Charleston (See figure below). Click Next when finished.
- The next screen allows you to select a default set. This will populate the analysis user interface pages with default data where applicable (e.g. default fragilities, default fragility mapping, etc). From the dropdown menu, select MAEviz 3.0 South Carolina Defaults. Note: For completeness, this tutorial will assume that no default set has been chosen so you might find some fields that you are requested to fill in already filled in for you. In these cases, you can ignore the tutorial instructions. Click Finish to complete the wizard and have MAEviz initialize your new scenario.
Viewing the Scenario and Adding Data
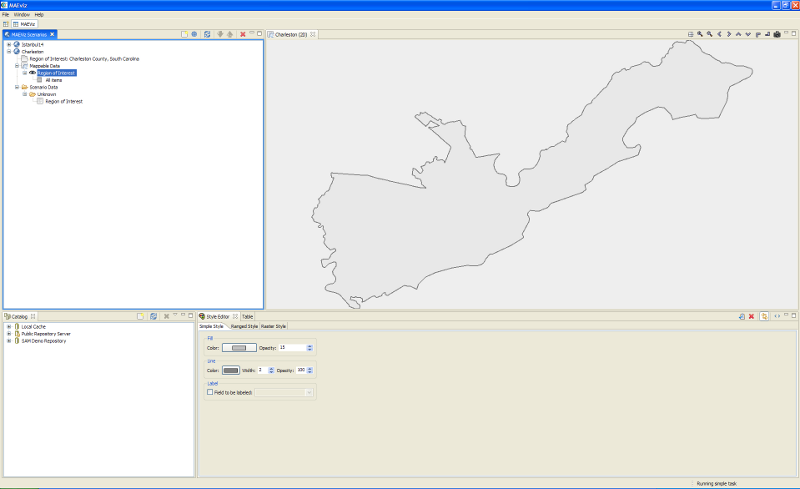
At this point, your scenario has been created. You will see your scenario listed in the Scenario View and a blank outline of Charleston County has appeared in the Visualization View. See figure below.
At this point, we will learn how to add data to our scenario, and how to manipulate the Visualization View.
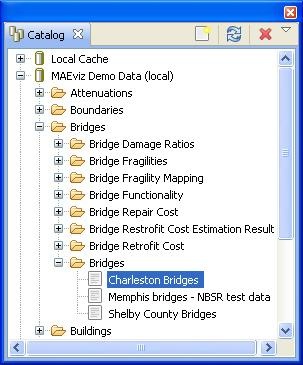
- First, we will add bridge data to the scenario. In the Catalog view (the lower-left view if your workbench is arranged in the default setting, as shown in the figure below), expand the MAEviz Demo Data item, then Bridges, Bridges, then select the bridge dataset for our study area, Charleston Bridges. Click and drag the Bridge datasets into the Visualization View. Alternatively, you can right-click the item and select Load Dataset.
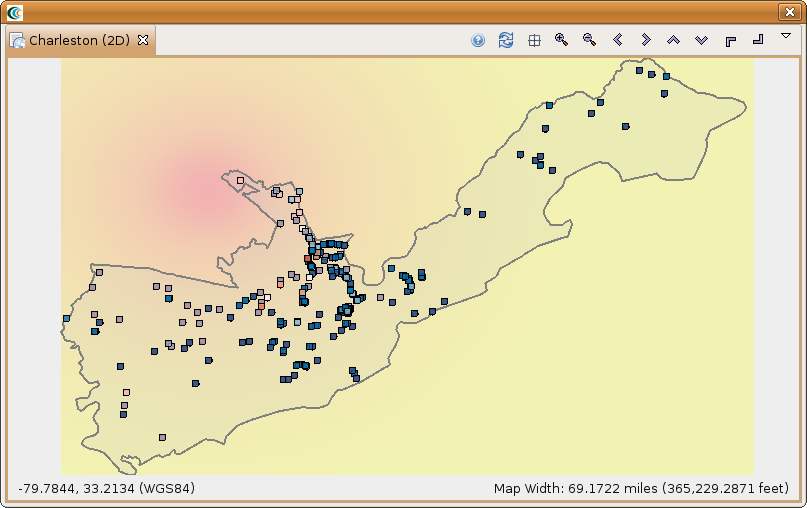
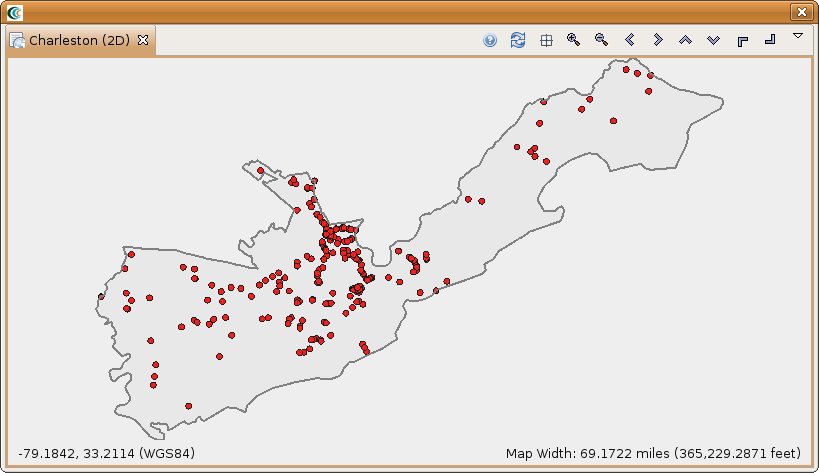
- At this point, bridges of the Charleston County should have been added to the Visualization View, and your Visualization View should look something like the figure below.
Some visualization controls:
- To zoom/pan/etc, use the controls at the top of the Visualization View.
- To view a 3d rendered view of the same information, right click the entry for your Scenario, and choose Render in 3D (VTK). This will bring up a second Visualization View that shows the same map, but from a 3d rendered perspective.
- After adjusting your view, if you want to restore to the original default view in the Visualization, click the Zoom to full extent button in the toolbar (
 )
)
Running an Analysis
Now that we have a basic map to look at, we will learn how to run an analysis. Analyses in MAEviz consist of any calculation that generate data. For example, generating a deterministic earthquake map based on a moment magnitude and epicenter would be considered one type of analysis. Using that earthquake map as well as bridge inventory data to generate information about bridge damage would be another type of analysis.
In this example, we want to find bridge damage results based on a deterministic earthquake hazard that we will generate.
- First, we will launch the Run Analysis Wizard. To do so, either click the Execute Analysis toolbar button (
 ), or right click your scenario and select Execute Analysis.
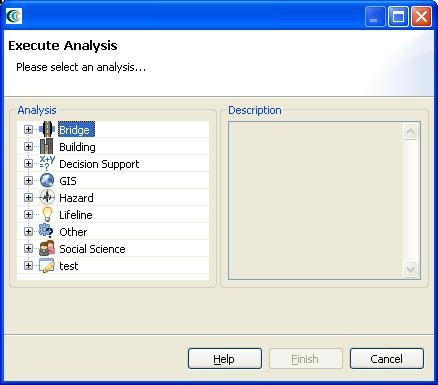
 - This causes the Run Analysis Wizard to be shown. See Figure below. Here you can select which analysis you want to run. From this page, expand Bridges, and select the Damage analysis. Click Finish.
- The page that displays will show you a graphical view of the damage analysis, including all of its inputs and the current readiness of the analysis. See the figure below. If the graph does not look as well spaced as the one below, you can use the refresh button (
 ) to improve the graph view. It might also be necessary to enlarge the graph view if more space is required.
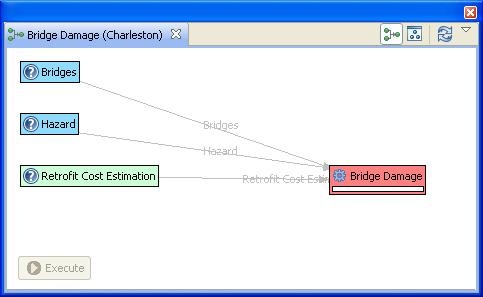
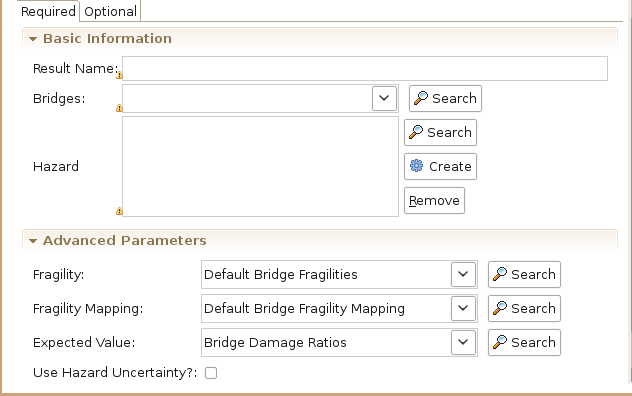
- The red background of Bridge Damage indicates that not all required inputs have been set. To begin, click once on the Bridge Damage box in the graph and an input form should appear below the analysis graph. See figure below. Under the required tab of the form, you will need to provide several inputs. Since we have a default set loaded, the form has several filled in fields and the next instructions will probably not apply to your scenario, but might be good to review. Otherwise, we would have to load datasets containing Fragilities, Fragility Mapping, and Expected Value into the scenario. To run this analysis, you must load datasets that contain these data if they are not already filled in. Also, select the bridges that we loaded from the Bridge drop-down menu and enter a name for the resulting dataset in the result name field (e.g. Bridge Damage).
- To help you locate or generate the necessary input data that we don't have in our scenario, the Analysis Form provides two types of buttons, the Find Dataset button (
 Search), and the Generate Dataset from Analysis button ( Create)
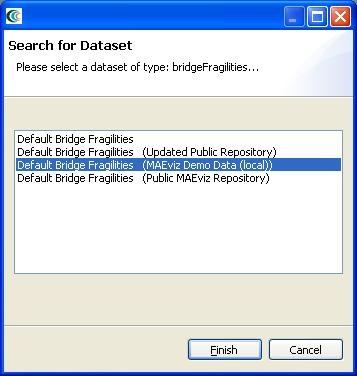
- To find a Fragilities dataset to run your bridge damage with, click the Find Dataset button ( ). The window that appears contains a list box of all Fragilities Datasets that could be found in any of the data repositories that you are connected to. Select Default Bridge Fragilities from the list, and click Finish. See figure below. To find an Expected Value dataset follow the same steps for the related field and select Bridge Damage Ratios from the list, and click Finish. Follow the same steps for the Fragility Mapping dataset but select Default Bridge Fragility Mapping from the list.
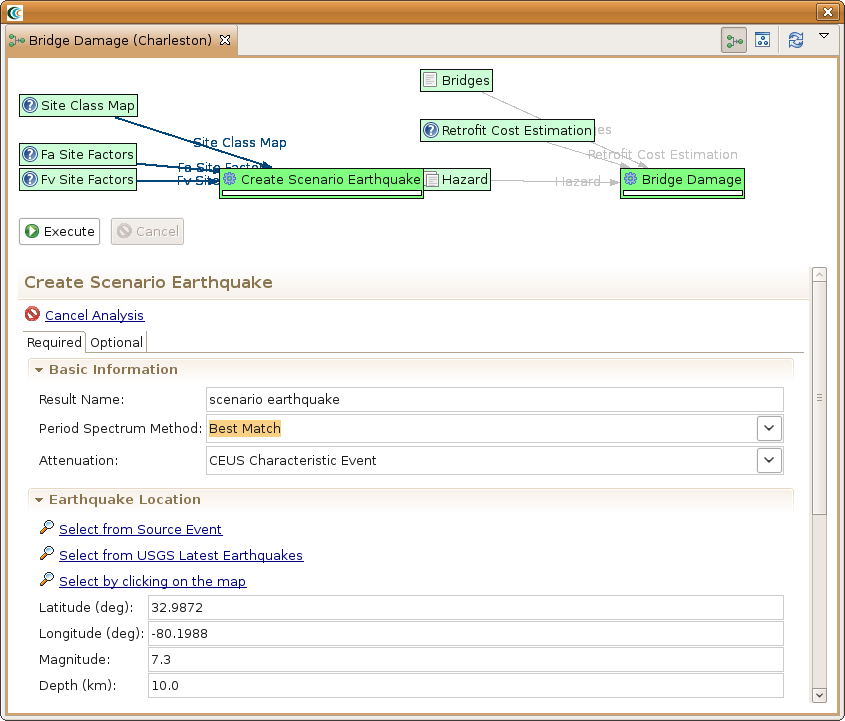
- For our hazard, we want to create a deterministic earthquake hazard. So this time, use the Create button to add a scenario earthquake analysis node to the graph. Click on the Create Scenario Earthquake box and you should see a form similar to the bridge damage analysis form. You will need to fill in a result name and select CEUS Characteristic event for the Attenuation. Under Earthquake Location, enter 32.9872 for latitude, -80.1988 for longitude, 7.3 for magnitude and 10.0 for depth. The rest can be left with the default values. See figure below.
- After doing this, both the Create Scenario Earthquake box and the Bridge Damage box should have turned green. Click the Execute button. Alternatively, we could have clicked the optional tab on the bridge damage analysis form and selected to apply some retrofits. By default, MAEviz will use the as-built fragility for each bridge unless we specify to use retrofit fragilities in the optional tab. Once the progress bars have finished for each analysis, you should see new datasets added to your Scenario View and map: a Bridge Damage dataset which will contain the damage information, and the earthquake hazard dataset. Your Visualization should now look similar to the figure below with the bridges colored by mean damage.