Motivation
Performance tuning and profiling can be a daunting task, but it doesn't have to be with Eclipse. A couple basic tools are included with most linux distributions providing code coverage analysis and function profiling: gprof and gcov. Using just these 2 tools, it's easy to gain understanding of how your code is running. With the linuxtools component of Eclipse incubation project ( http://www.eclipse.org/linuxtools/![]() , now bundled with PTP) , using gprof and gcov with your code is simplified and their reports are fully integrated with into the cdt editor perspective. Let's see how the linuxtools project adds value and puts a fresh look on these classic linux code analysis tools.
, now bundled with PTP) , using gprof and gcov with your code is simplified and their reports are fully integrated with into the cdt editor perspective. Let's see how the linuxtools project adds value and puts a fresh look on these classic linux code analysis tools.
Demo : Shallow water weather model
The Shallow demo project from the eclipse tutorial cvs can be used with gprof and gcov with a few simple adjustments to the Makefile and MPI runtime. Here are the details and some discussion of what can be done with the profiling and coverage output.
...
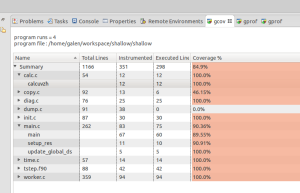
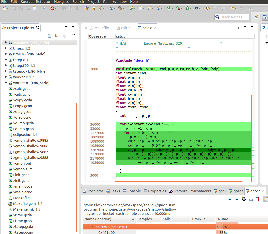
Selecting (double click) a source code line from either the gcov or gprof view and you'll see the file and routine highlighted in the cdt c/c++ perspective. 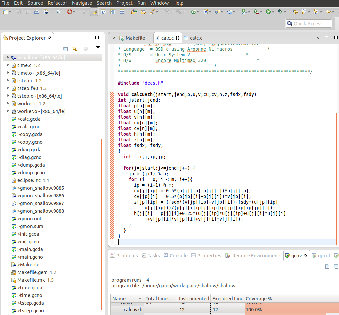
References:
http://wiki.eclipse.org/Linux_Tools_Project/GProf/User_Guide
...