...
- Python
- JS
...
Another useful fetch command is fetchCount. This function is nearly identical to the fetch commands above, but it just returns the number of records which match the fetch filter. This is useful when trying to determine whether a given search is refined enough.
| Code Block | ||
|---|---|---|
| ||
OutbreakLocation.fetchCount({'filter': 'exists(latestTotalPopulation)'}) |
The same in python is:
| Code Block | ||
|---|---|---|
| ||
c3.OutbreakLocation.fetchCount(spec={'filter': 'exists(latestTotalPopulation)'}) |
...
A Code Example in Jupyter Notebook:
| Code Block | ||
|---|---|---|
| ||
import pandas as pd
df = pd.DataFrame(raw_data.objs.toJson())
df.head()
df.drop('meta', axis=1, inplace=True)
df.drop('type', axis=1, inplace=True)
df.drop('version', axis=1, inplace=True)
df.drop('id', axis=1, inplace=True)
df.head() |
...
On the static console, using the 'c3Grid' displays evaluate's result nicely:
| Code Block | ||
|---|---|---|
| ||
var eval_result = OutbreakLocation.evaluate({
    'projection': 'avg(countryArea), locationType',
    'group': 'locationType',
    'filter': 'exists(countryArea) && exists(locationType)'
})
c3Grid(eval_result) |
...
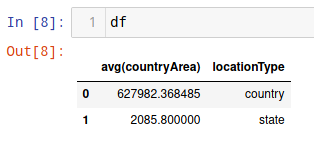
We can also use 'evaluate' in Python, but we have to use a helper function. We've defined this for you with the DTI's c3python module available here: https://github.com/c3aidti/c3python
| Code Block | ||
|---|---|---|
| ||
eval_spec = {
    'projection': 'avg(countryArea), locationType',
    'group': 'locationType',
    'filter': 'exists(countryArea) && exists(locationType)'
}
eval_res = c3.OutbreakLocation.evaluate(eval_spec)
df = c3python.EvaluateResultToPandas(result=eval_res, eval_spec=eval_spec) |
Here's another example in Python:
| Code Block | ||
|---|---|---|
| ||
spec = c3.EvaluateSpec(
    projection="ethnicity, count(ethnicity)",
    group="ethnicity"
)
c3python.EvaluateResultToPandas(result=c3.SurveyData.evaluate(spec), eval_spec=spec) |
...
Another type of SimpleMetric is a tsDecl (Timeseries Declaration) metric. tsDecl metrics are often used to turn non-timeseries raw data (e.g., event data, status data, or data with irregular intervals) into timeseries. tsDecl metrics have the same fields as standard SimpleMetric, except for the 'tsDecl' field, which replaces the 'expression' field. tsDecl metrics may allow users the added flexibility to define new metrics which the expression field may not support. Using a tsDecl metric, the above metric can be re-written as:
| Code Block | ||
|---|---|---|
| ||
met = c3.SimpleMetric(
	id='JHU_ConfirmedCases3_OutbreakLocation',
	name='JHU_ConfirmedCases3',
	srcType='OutbreakLocation',
	path="aggregateMeasurements.(measurementType == 'confirmed' && origin == "
       "'Johns Hopkins University')",
	tsDecl={
		'data': 'data',
		'treatment': 'AVG',
		'start': 'start',
		'value': 'value'
	}
) |
...
In Python, you can also specify the spec using a Dictionary without creating an EvalMetricsSpec Type:
| Code Block | ||
|---|---|---|
| ||
results = c3.OutbreakLocation.evalMetrics(spec={
	'ids': [ 'Illinois_UnitedStates', 'California_UnitedStates', 'UnitedStates' ],
	'expressions': [ 'JHU_ConfirmedCases', 'JHU_ConfirmedDeaths' ],
	'start': '2020-01-01',
	'end': '2020-08-01',
	'interval': 'DAY',
}) |
...
Similarly, we don't have to explicitly create an EvalMetricsSpec type:
| Code Block | ||
|---|---|---|
| ||
var results = OutbreakLocation.evalMetrics({
    'ids': ['Illinois_UnitedStates', 'California_UnitedStates', 'UnitedStates' ],
    'expressions': [ 'JHU_ConfirmedCases', 'JHU_ConfirmedDeaths' ],
    'start': '2020-01-01',
    'end': '2020-08-01',
    'interval': 'DAY'
})
c3Viz(results) |
...