...
In contrast to the current system, the service oriented architecture (SOA) allows for many services such as Google Maps, Web Feature Services (WFS), and ArcIMS to provide clients with data that is then rendered on the client-side using a Javascript-based tool called OpenLayers(see Figure 2below).

Figure 2. Proposed Architecture
OpenLayers is an open source Javascript library for delivering dynamic map content to any web page. It can display map tiles and markers loaded from any source and is supported by the open source community. By abstracting out the server side and setting up a common interface between the client and the server side, any map service or custom coded library can provided content and functionality to the client removing the limitation of waiting for the commercial vender to provide new features and bug fixes. User interaction will also be improved since the clients have more control over rendering and visualization; however, some of the advanced rendering capabilities provided by ArcIMS would have to be custom coded and there will be more computational load on the client. This increased computational load is partially mitigated by the increasing computational power available to common users.
!mm_arch_new.jpg!Figure 2. Proposed Architecture
Another advantage of this SOA is the ability to integrate current and future capabilities being developed by NCSA Cyberenvironments and Technologies (CET) division such as high performance computing access, scaling for large data, data analysis, provenance tracking, and metadata integration to deliver a richer user experience and to potentially collaborate on future projects to provide required functionality by the Market Maker Community.
...
- Map
- Query Builder
- Search Results Table as shown in Figure 3.
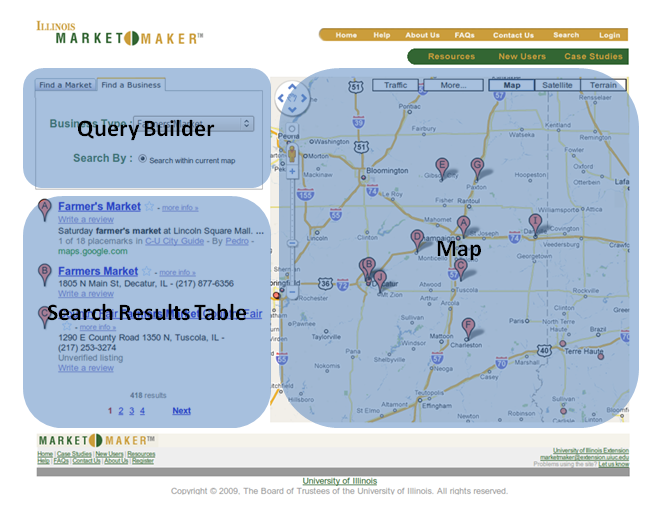
Figure 3. Mock-up user interface and major parts
Map
This component will be implemented by using OpenLayers toolkit and will display the selected map layers overlaid. For this project, we will support at least two layers extracted from the current Market Maker database, Illinois census tracts and Illinois business locations. In addition, background layers from Google Maps will also be supported. The map component will show detailed information for each geospatial entity by clicking on or hovering the mouse over the entity. A map legend and navigation bar will also be provided.!mm_mockup.png!Figure 3. Mock-up user interface and major parts
Query Builder
Users will use the query builder to define and refine their criteria for the information they want to be displayed on the map and table (or list). As the user changes their criteria, the other components will be updated automatically.
...