| Table of Contents |
|---|
Overview
This guide will show our users how to use the TensorFlow Profiler to profile the execution of your TensorFlow code.
Code example
Copy and paste the following code into tf-profile.py.
...
Run the code with command
Code Block language bash python tf-profile.py
Compress the logs folder
Code Block language bash tar -zcvf ./logs.tar.gz ./logs
Download the tarball file with sftp and/or hal-ondemand.
Decompress the tarball file
Code Block language bash tar -zxvf ./logs.tar.gz
Install the tensorboard profile plugin in your python environment.
Code Block language bash pip install tensorboard_plugin_profile
Launch the tensorboard with profiler installed.
Code Block language bash tensorboard --logdir ./logs
- Open the tensorboard dashboard in your web browser. (Google Chrome is strongly recommended)
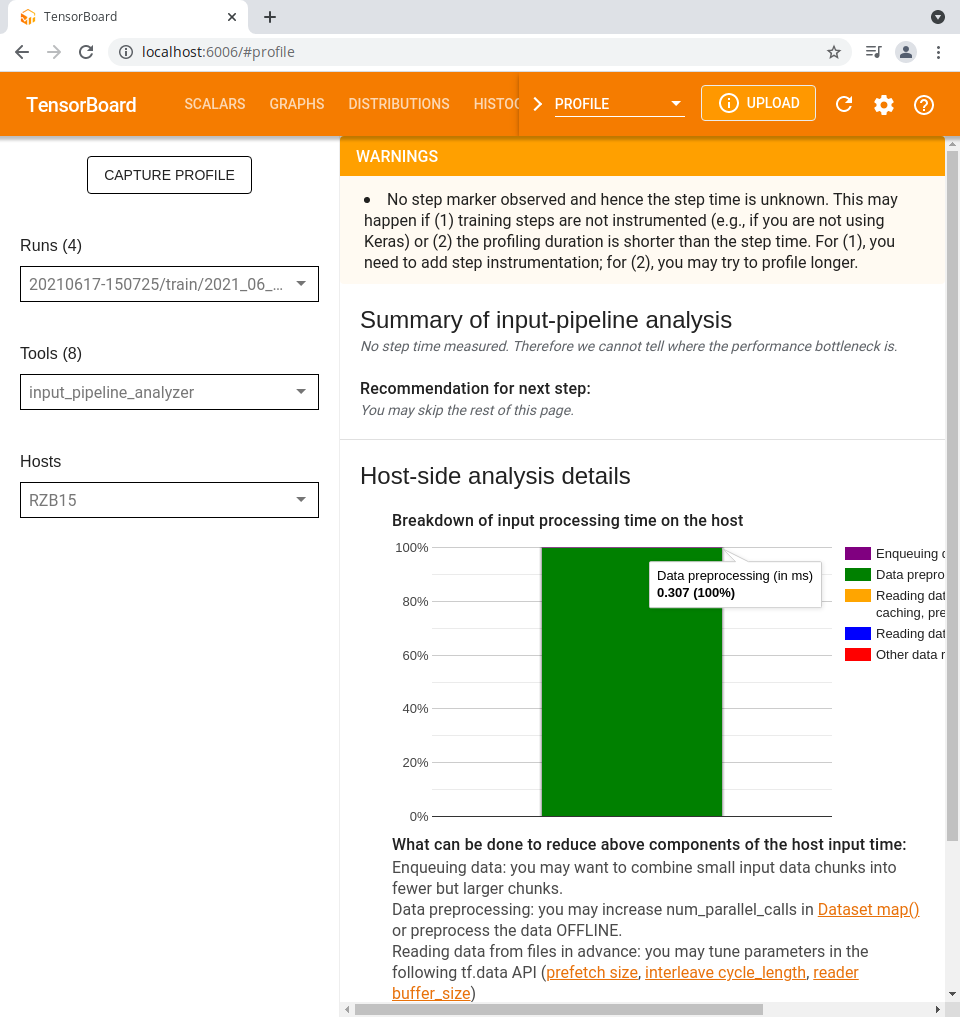
Remote Profiling on HAL system
...