...
| Code Block | ||
|---|---|---|
| ||
... #SBATCH --constraint=perf cd $SLURM_SUBMIT_DIR export PATH=/sw/external/amd/AMDuProf_Linux_x64_4.0.341/bin:$PATH set -v srun AMDuProfCLI collect --config tbp -o `pwd`/uprof_tbp `pwd`/stream.22gb srun AMDuProfCLI collect --config inst_access -o `pwd`/uprof_inst_access `pwd`/stream.22gb srun AMDuProfCLI collect --config assess -o `pwd`/uprof_assess `pwd`/stream.22gb srun AMDuProfCLI collect --config assess_ext -o `pwd`/uprof_assess_ext `pwd`/stream.22gb |
...
The Analyze tab shows hot routines or lines in more detail. The tbp and , assess, and inst_access Analyze views follow.
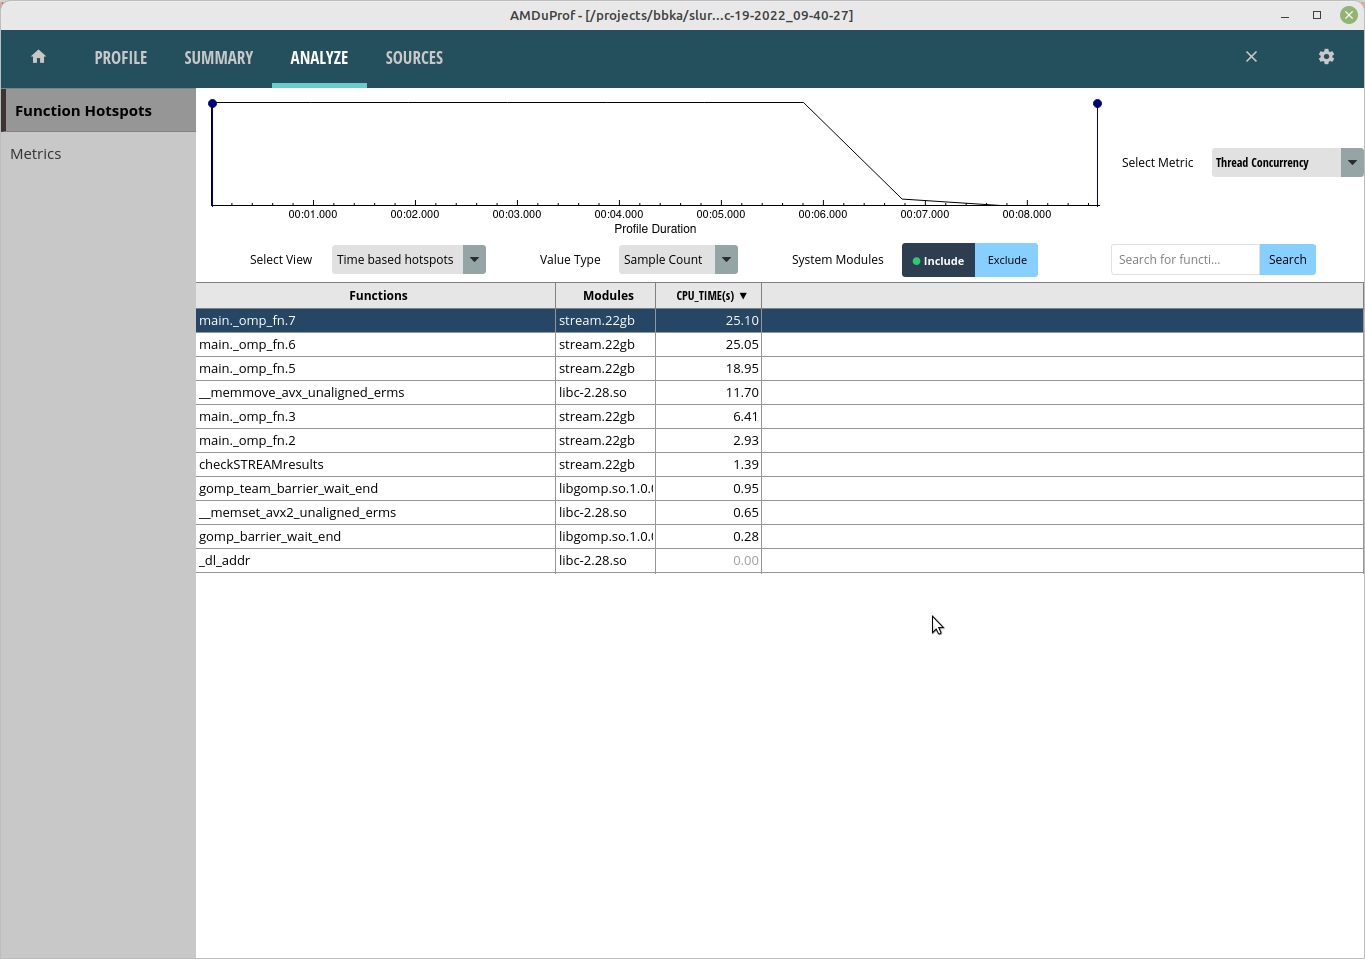
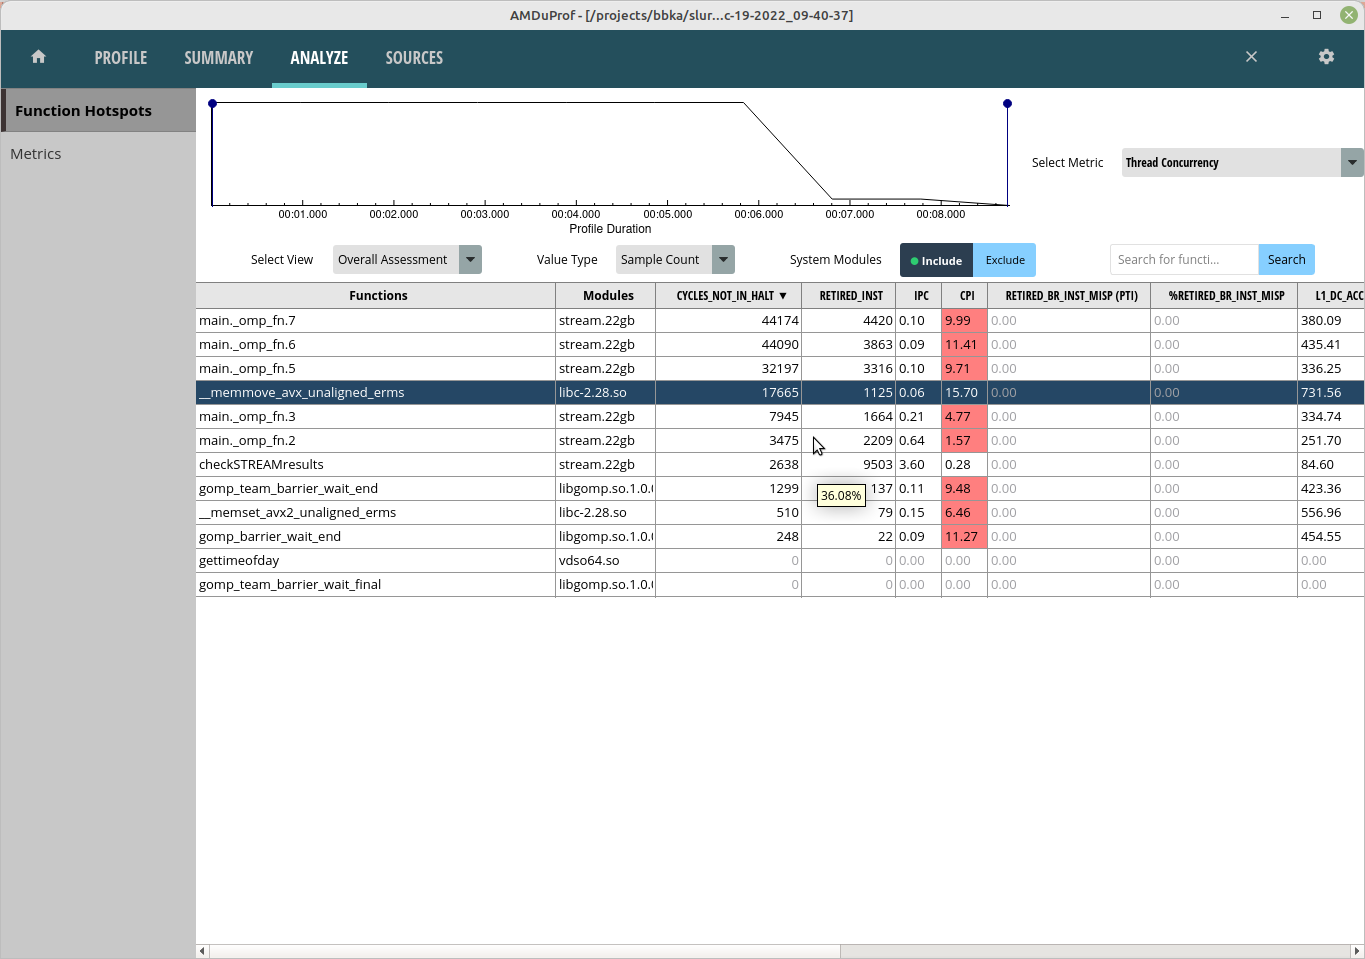
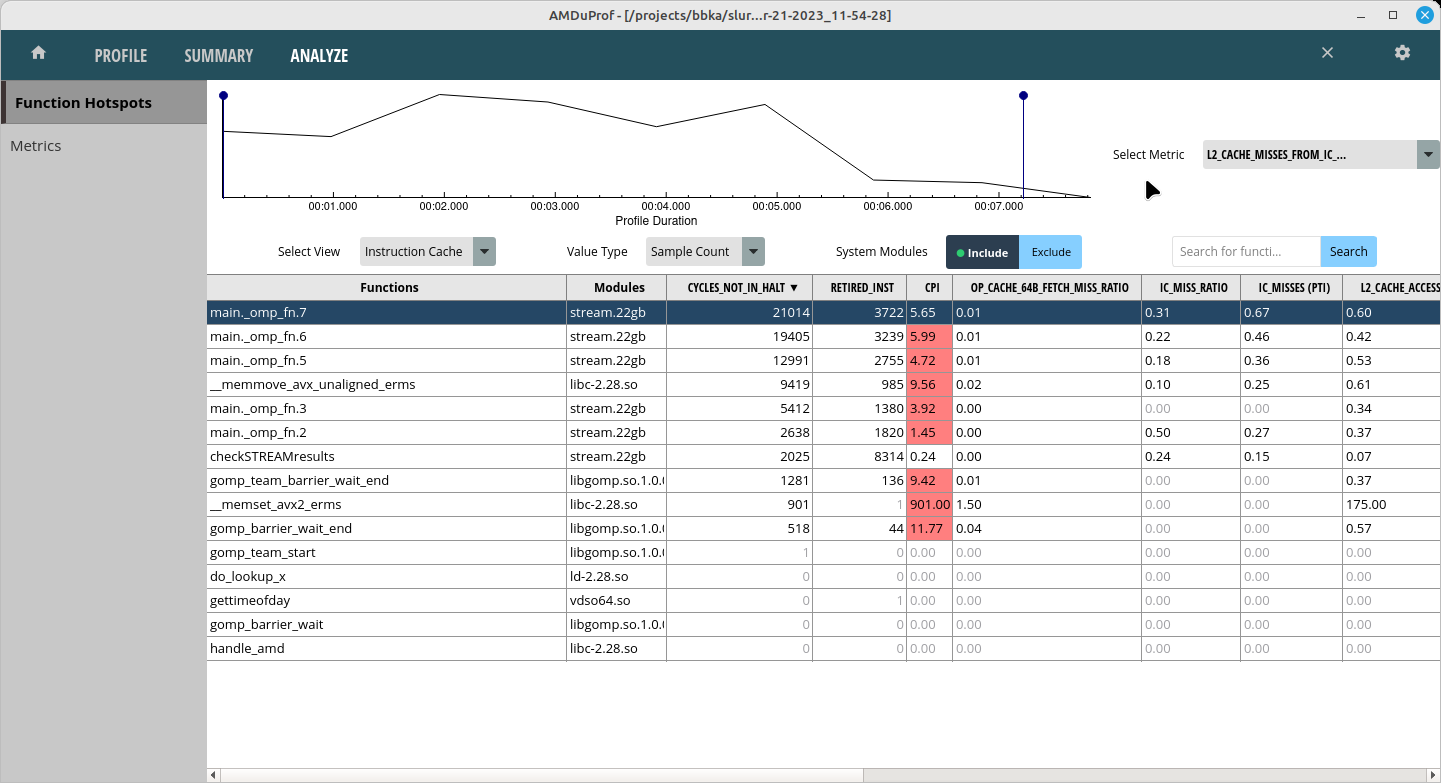
Selecting one of the lines or routines will take you to the Sources view where you can see the assembly used in that portion of code.
...
The Session Info is under the Summary tab and displays more detail about the profiling session.

References:
https://developerwww.amd.com/wp-content/resources/57368_AMD_uProf_v4.0_GA_UGdam/amd/en/documents/developer/uprof-v4.0-gaGA-user-guide.pdf