Click in the link above if you are not automatically redirected in 5 seconds.
run and collect data
Run a batch job and collect data:
...
#SBATCH --constraint=perf  # perf,nvperf for gpu nodes

cd $SLURM_SUBMIT_DIR
export PATH=/sw/external/amd/AMDuProf_Linux_x64_4.0.341/bin:$PATH

set -v
srun AMDuProfCLI collect --config tbp  -o `pwd`/uprof_tbp  `pwd`/stream.22gb
srun AMDuProfCLI collect --config inst_access  -o `pwd`/uprof_inst_access  `pwd`/stream.22gb
srun AMDuProfCLI collect --config assess  -o `pwd`/uprof_assess  `pwd`/stream.22gb
srun AMDuProfCLI collect --config assess_ext  -o `pwd`/uprof_assess_ext  `pwd`/stream.22gb
generate report
After collecting data from a batch job, generate reports with the AMDuProfCLI report option.
[arnoldg@dt-login03 uprof_tbp]$ export PATH=/sw/external/amd/AMDuProf_Linux_x64_4.0.341/bin:$PATH
[arnoldg@dt-login03 uprof_tbp]$ AMDuProfCLI report -i AMDuProf-stream-TBP_Dec-19-2022_09-40-27/
/sw/external/amd/AMDuProf_Linux_x64_4.0.341/bin/AMDuProfCLI
Translation started ...
Translation finished
Generated database file : cpu
Report generation started...
Generating report file...

Report generation completed...

Generated report file: /projects/bbka/slurm_test_scripts/cpu/stream/uprof_tbp/AMDuProf-stream-TBP_Dec-19-2022_09-40-27/report.csv
visualize and explore report data
You can view the data in AMDuProf on Delta or locally on a copy you install at your desktop system. If you install locally, you may need to replicate some paths or add paths to the binary in order to get full functionality.
Launch AMDuProf ( no CLI suffice for the GUI ), and import the profile session from a completed batch job run with AMDuProfCLI collect ...

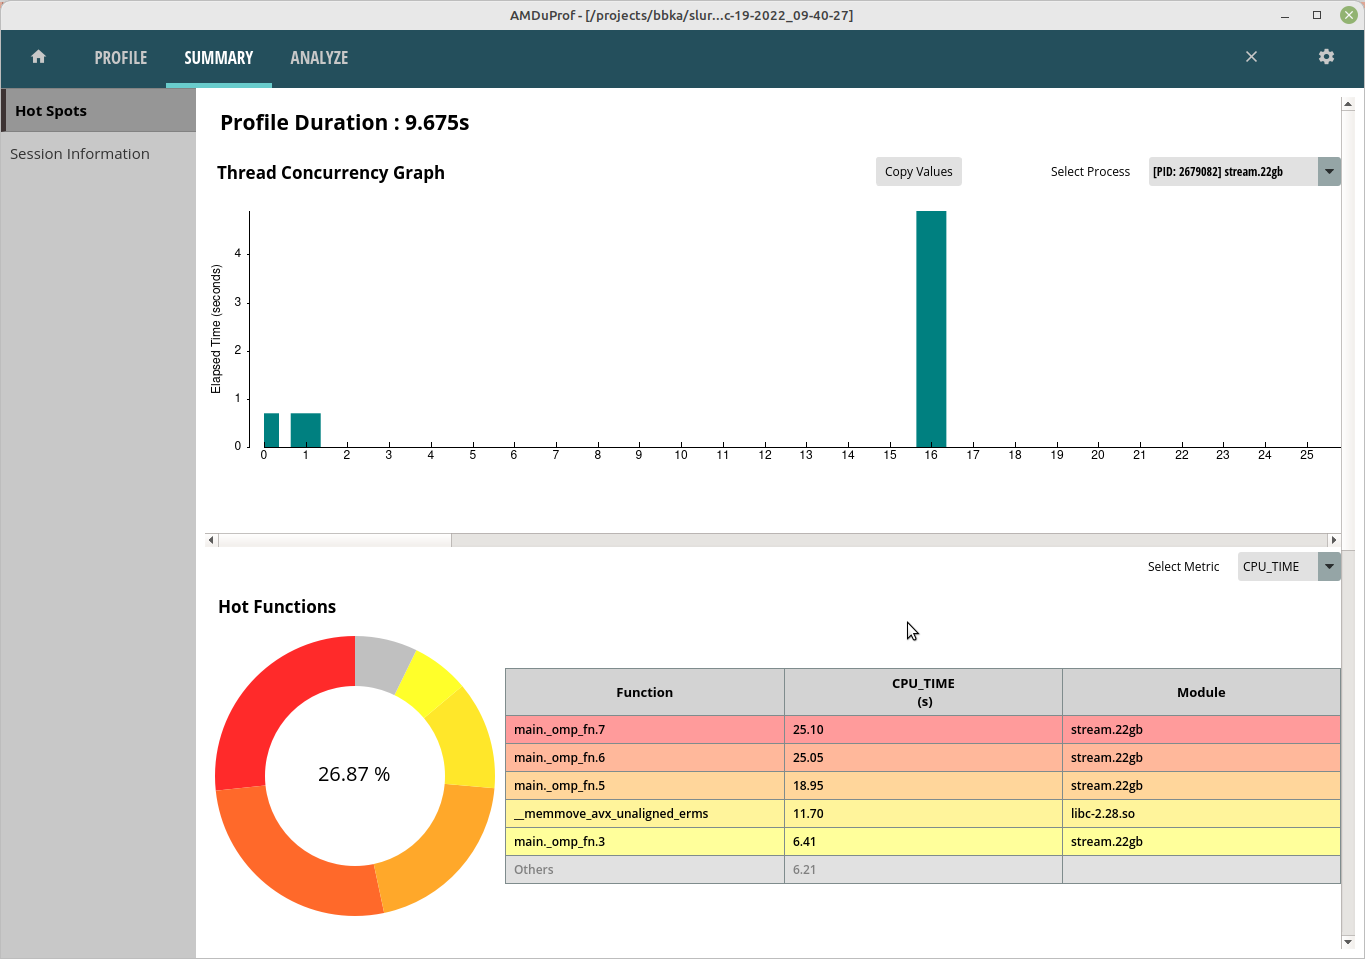
The summary view give a high level overview of how time was spent. This is the tbp time-based-profile summary.
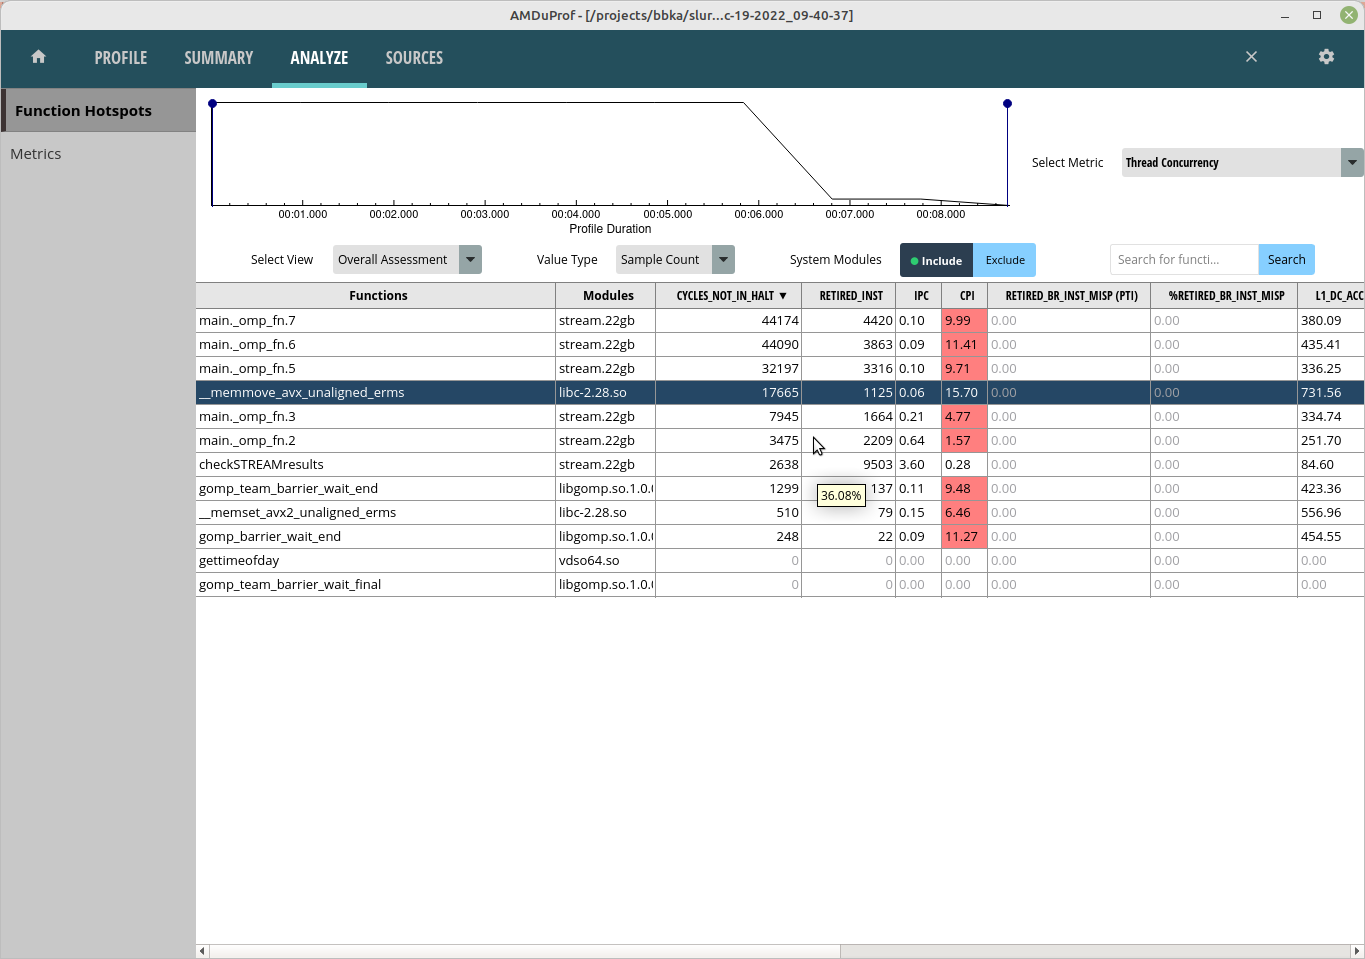
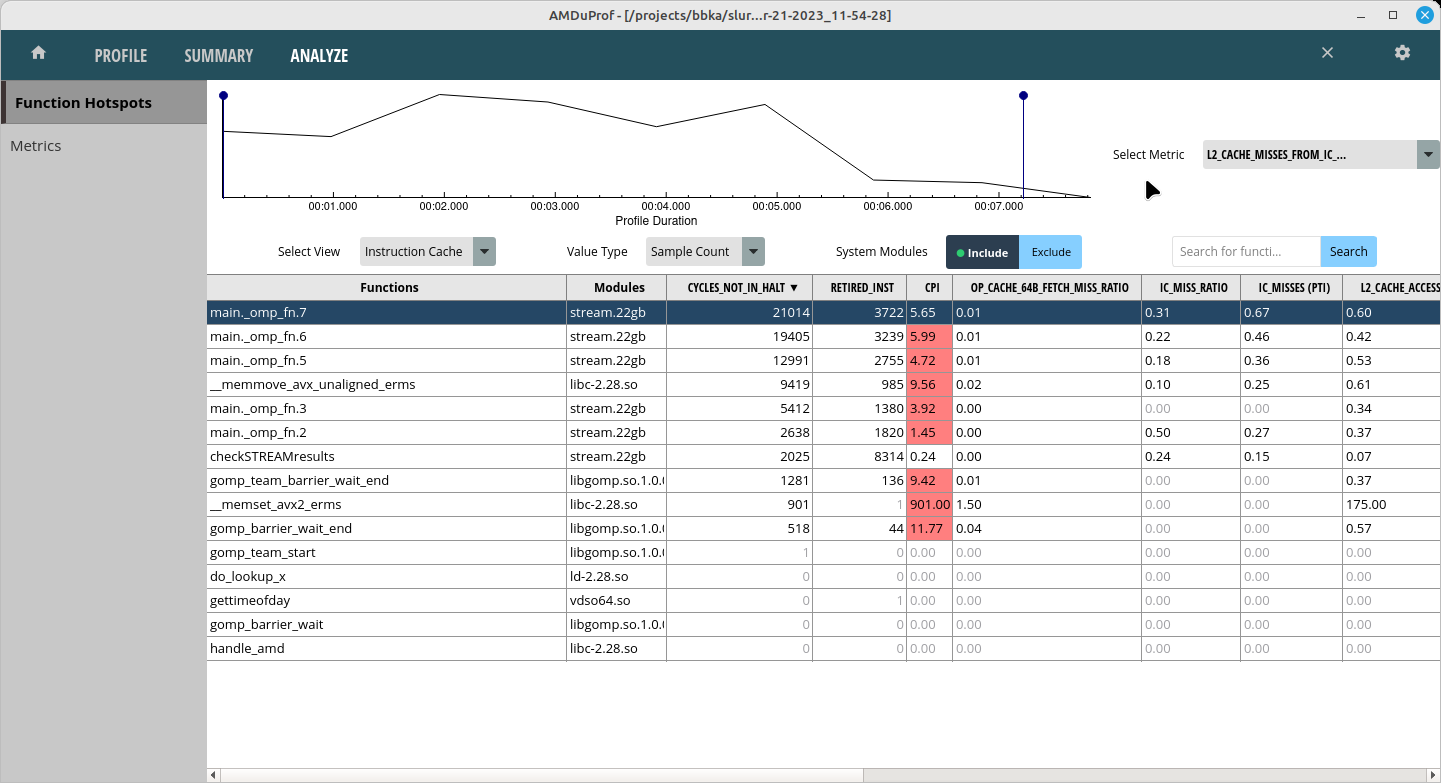
The Analyze tab shows hot routines or lines in more detail. The tbp , assess, and inst_access Analyze views follow.
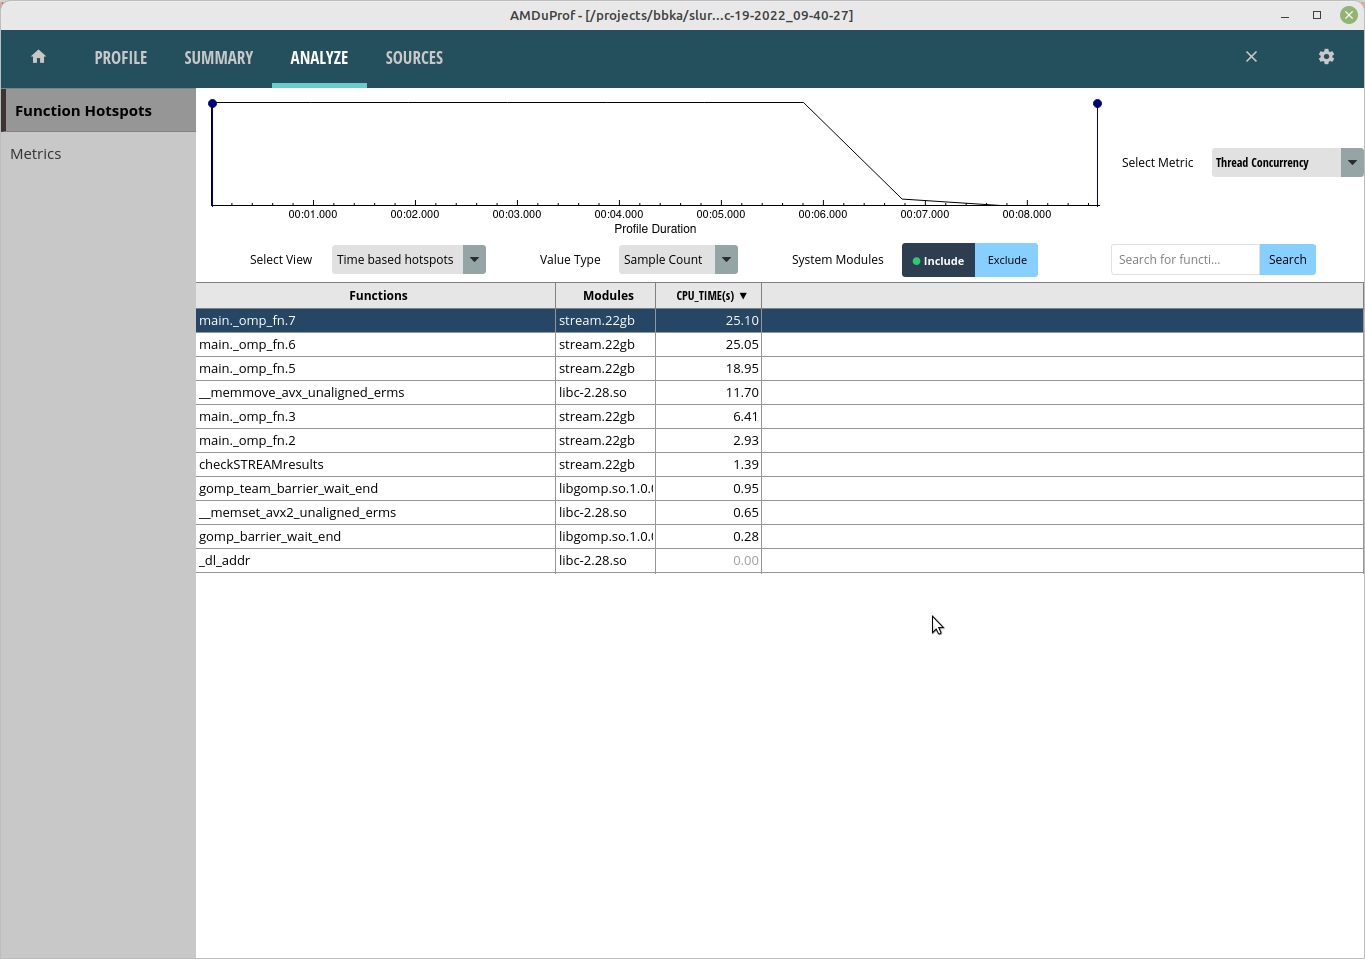
Selecting one of the lines or routines will take you to the Sources view where you can see the assembly used in that portion of code.

The Session Info is under the Summary tab and displays more detail about the profiling session.

References:
https://www.amd.com/content/dam/amd/en/documents/developer/uprof-v4.0-gaGA-user-guide.pdf
2 Comments
Galen Arnold
Related: https://perf.wiki.kernel.org/index.php/Main_Page
Coming someday ? : https://docs.python.org/pt-br/dev/howto/perf_profiling.html
Galen Arnold
Rooflines are currently disabled: https://www.amd.com/content/dam/amd/en/documents/developer/uprof-v4.0-gaGA-user-guide.pdf (section 3.5.2 ):