...
Import the profile session from a completed batch job run with AMDuProfCLI collect ...

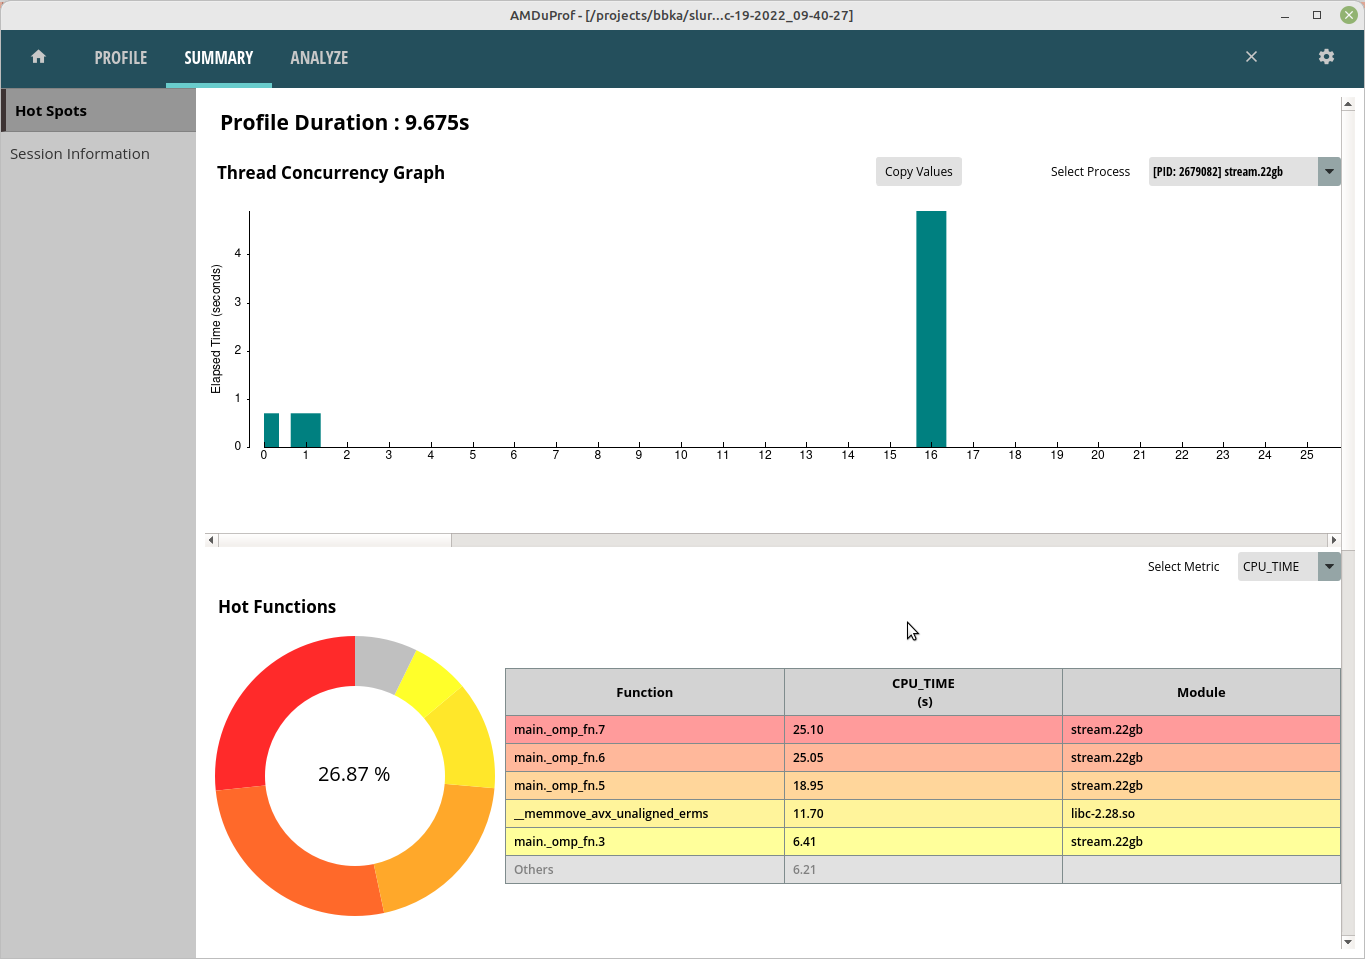
The summary view give a high level overview of how time was spent. This is the tbp time-based-profile summary.
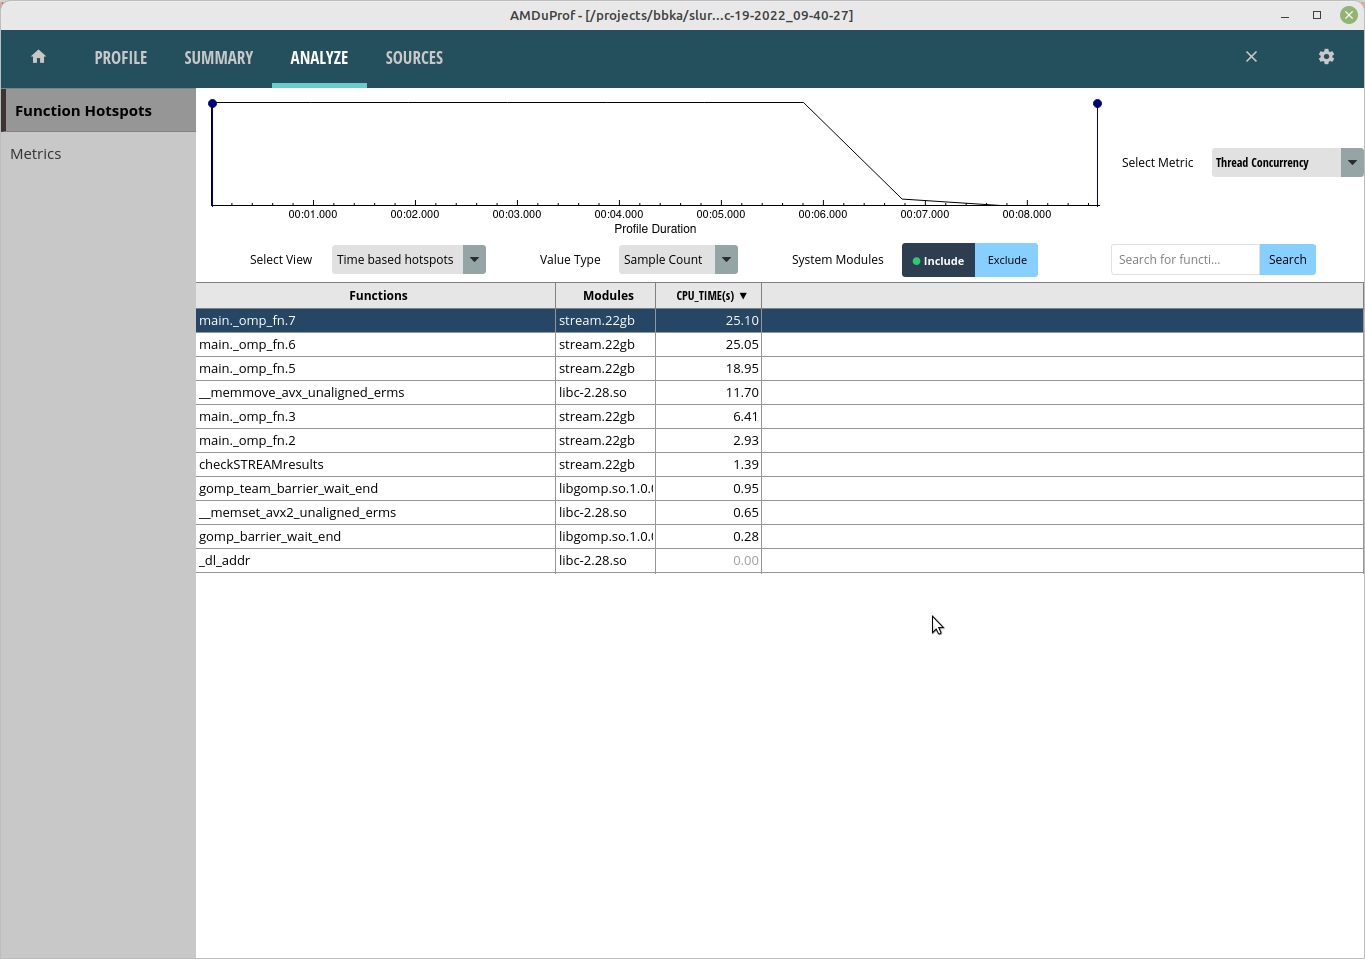
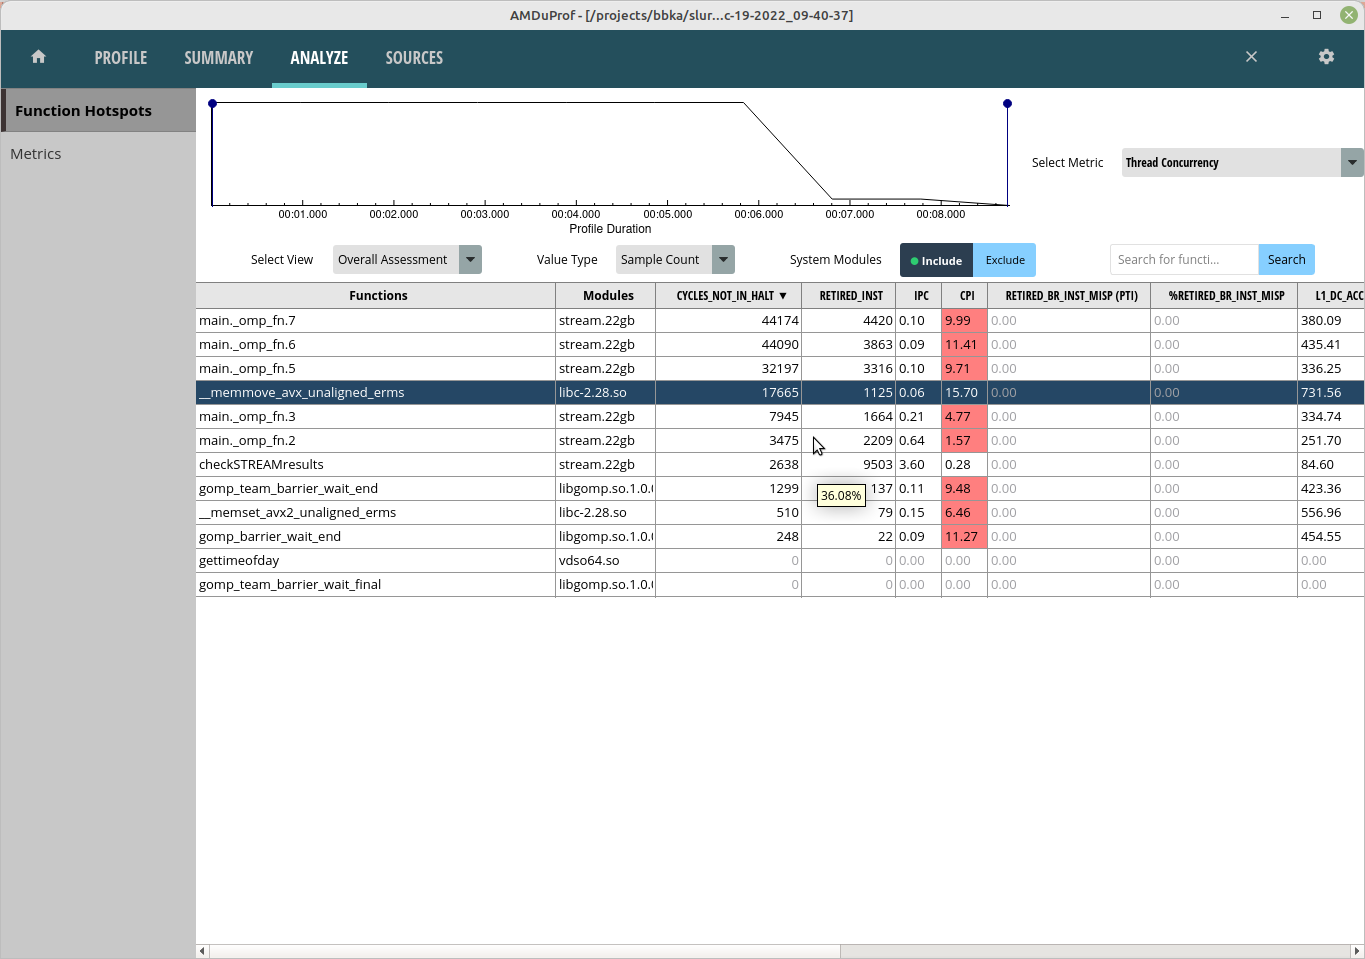
The Analyze tab will shows hot routines or lines in more detail. The tbp and assess Analyze views are shown.
Selecting one of the lines or routines will take you to the Sources view where you can see the assembly used in that portion of code.

The Session Info is under the Summary tab and shows more detail about the profiling session.
