NCSA wiki will be offline Friday, Apr 19, 2024, from 1700 hours until Sun, Apr 21, 2024 in order to upgrade Confluence.
Introduction
In this demonstration, MAEviz will be used to perform a damage analysis on some buried pipelines in Shelby County Tennessee. It is assumed that the user has already worked through the MAEviz Introduction and Tutorial and is familiar with the basic functions of MAEviz that can be found in the Building and Bridge Damage Tutorials. If not, then it is suggested that the user do this first before continuing with this tutorial. The sections that follow will take the user through the ingestion process (to get some pipeline data into MAEviz) and then run a sample analysis using the Buried Pipeline Sample Inventory for Shelby County Tennessee that can be found in the MAEviz Public Repository.
Tutorial Example
Data
Pipeline data can come in many formats; however, for use in MAEviz, the data must be in shapefile format and contain at a minimum, the pipe material type (e.g. cast-iron, pvc) and the diameter. Additional attributes such as joint type and soil type may be required, depending on which fragilities the user wants to assign to the pipeline data. A column for joint type and soil data are required to exist (even if they contain no information) because the schema for this type requires those columns to be present. If your dataset does not contain them, then they will need to be added before ingesting the pipeline dataset into MAEviz. Another useful field is the length field since this can be used to determine the number of repairs based on the repair rate. Below is a list of the fields required to be present in the dataset:
Field Name |
Field Description |
Field Type |
|---|---|---|
pipetype |
the pipe material |
string |
jointtype |
the type of joint |
string |
diameter |
the diameter of the pipe |
double |
length |
the length of the pipe section |
double |
soiltype |
the type of soil that the pipe is in |
string |
Import
Now that we have a better understanding of the data format, we will go through the process of importing a buried pipeline into MAEviz. These steps will be just the generic steps since the file in the screenshots is only available in the Turkish version of MAEviz, but it will illustrate the process. If you are just going to use the MAEviz sample data, you can skip to the next section, View Pipeline Data.
- To import a pipeline dataset, launch MAEviz if you haven't already done so and go to File-> Import found in the top level menu. You should see a screen similar to the figure below.

- Click the Next button and select shapefile from the dropdown menu. You should now see a screen similar to the figure below.

- Click the Next button and then browse for the shapefile to ingest. Once a file is selected, the user can optionally add location tags to the dataset as metadata. In the future, MAEviz will use this information to determine which datasets are near or inside a region of interest. The screen should look similar to the figure below except that the file you chose will be in the text field.

- Click the Next button and then select Buried Pipeline Inventory from the drop down menu for data type. This tells MAEviz what type of data is being ingested so that the appropriate analyses are run on the data and where possible, UI fields can be auto-populated. The screen should look similar to the figure below.

- Click the Next button. You should now see a dialog that allows you to map your datasets attributes to the expected attributes. For example, whichever column contains the pipe material type should be mapped to the pipetype attribute. For the diameter attribute, select the column that contains the diameter information. The unit type of the diameter will also need to be selected from the Unit drop down menu (e.g. centimeters). MAEviz needs this information for any conversions that need to occur. See the figure below for an example mapping. Fields are case sensitive so JointType is different from jointtype.

- Click the Next button and you might see a dialog similar to the one below. If there are no extra fields in your dataset, then the dialog will be blank; however, if there are additional fields in your dataset you will be given an opportunity to assign them a more friendly-name (e.g. instead of bldgval you could give it Building Value as the friendly-name). The friendly-names will be stored as metadata with no alterations to the underlying dataset.

- In our case, there are no additional fields to set information for so click the Next button again if you also have a blank dialog. MAEviz will now prompt for a repository to put the dataset in, a descriptive name and a version number. See the figure below for an example.

- When MAEviz was initially installed, it created a repository called MAEviz Demo Data, which can be used to ingest the pipeline data into. Otherwise, choose a different repository or set one up through the MAEviz catalog view before ingesting the pipeline data. Click the Finish button when all fields have been entered.
Example Scenario
From this point forward we will assume that you are using the sample dataset and will give instructions related to that scenario. In this example scenario, we are going to generate a fictitious earthquake in Shelby County, Tennessee and determine the pipeline damage for the region. If you have not already done so, then you will first need to launch MAEviz.
View Pipeline Data
- Next, create a scenario with Shelby County, Tennessee as your region of interest and choose the MAEviz 3.1.1 Analysis Defaults as your default set.
- Find the MAEviz Demo Data repository in the Data Catalog view and expand Lifeline -> Buried Pipeline Inventory -> Buried Pipline Sample Inventory. You should see something similar to the figure below.

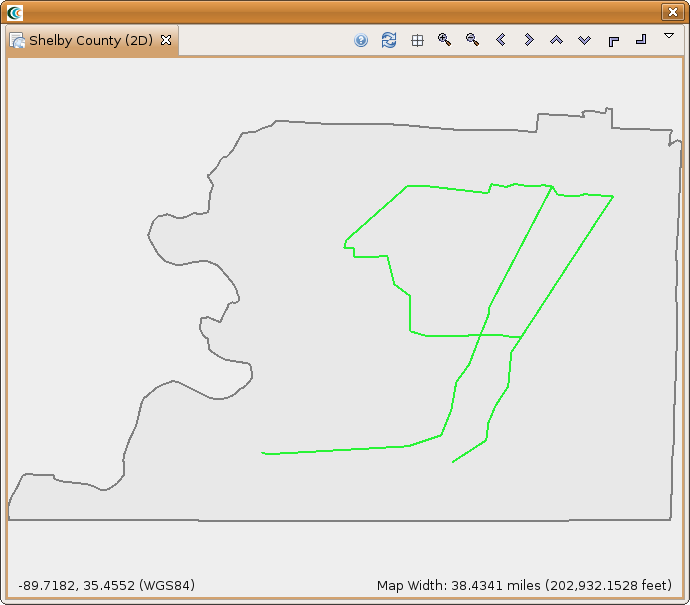
- Add the Buried Pipline Sample Inventory to your scenario and you should see something similar to the figure below.
Analysis
Next, let's look at running the Buried Pipeline Damage analysis. This analysis will compute the repair rate for each section of pipe based on the parameters set. To start, bring up the execute analysis window and select Lifeline -> Buried Pipeline Damage. You should see something similar to the figure below.

Most of the fields should be filled in by the default set. In our case we need to provide a Result Name, a Hazard, Fragilities and Fragility Mapping. For the Result Name we will use Shelby County Buried Pipeline Damage.
- For the Fragility field, search for and find the dataset Sample Buried Pipeline Fragility Set with Liquefaction.
- For the Fragility Mapping field, search for and find the dataset Sample Buried Pipe Fragility Mapping with Liquefaction.
- For the hazard, click the Create(
 ) button next to the Hazard field. This should add the Create Scenario Earthquake analysis to the graph. Click on Create Scenario Earthquake to bring up the form page.
 - Provide a Result Name, such as Memphis 7.0 Scenario EQ and set the magnitude to 7.0. For the Attenuation field, select CEUS Characteristic Event. You should have a form page similar to the one below.

- After all of the required fields are filled in, click the Execute button. You should see a damage visualization similar to the one below.