MAEviz Overview
Welcome 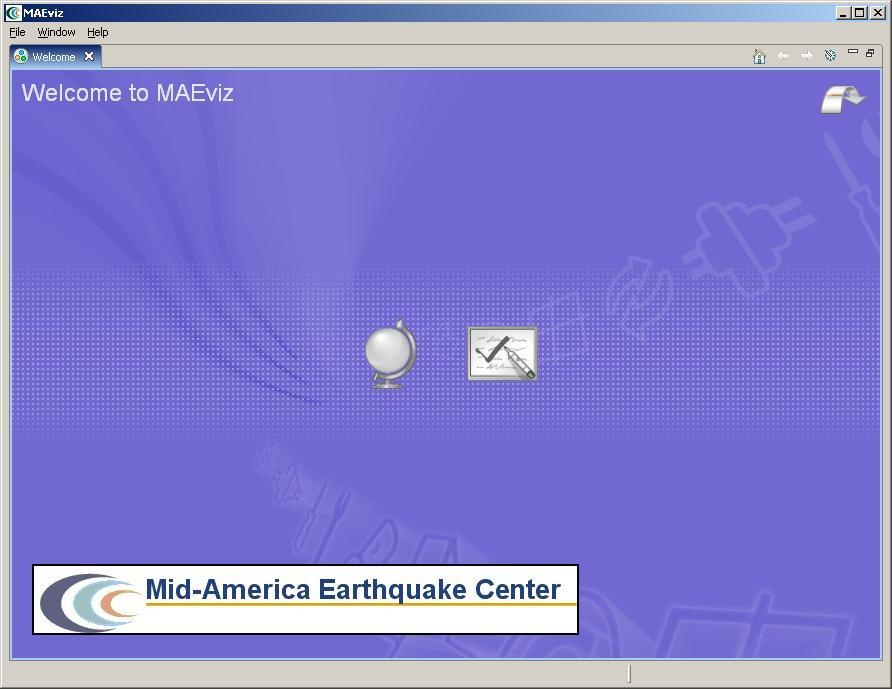
When MAEviz is first launched, the welcome screen appears. From the welcome screen, users can select to read an overview of information about MAEviz, follow built-in tutorials, or just begin working in MAEviz (by selecting Workbench which will take you to the main MAEviz screen, also known as the Workbench). See figure above.
Workbench Layout
The MAEviz workbench consists of a number of Views, each containing information about a specific part of MAEviz. Each view is like a sub-window within the MAEviz workbench window, and can be minimized, maximized, moved, or even torn away from the main window into its own window. These interactions are done by clicking the minimize and maximize view icons in the view's title bar, or by clicking and dragging on the view's border or title bar.
See the image below for the most commonly used views in MAEviz.
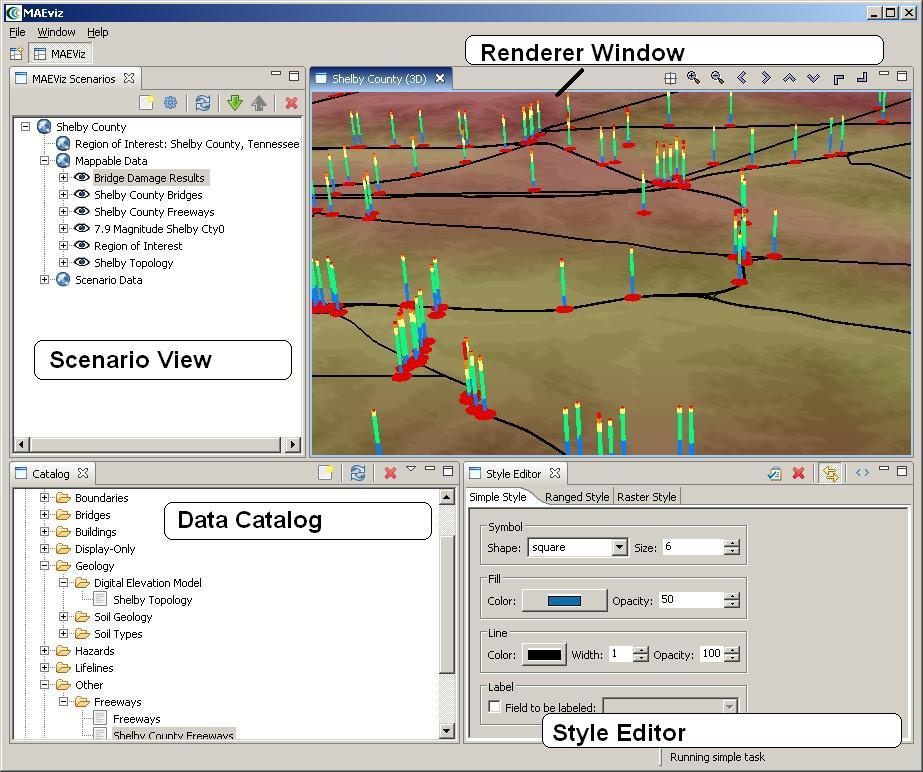
Scenario View
The Scenario View is where you will find a list of all the data for the scenario or scenarios that you are currently working with. Each scenario that you are working with is listed as a top-level item in this view, which can be expanded by clicking the plus ![]() icon next to its name, to see the details of the scenario. Inside each scenario, you can see a list of the Mappable Data and Scenario Data. All data listed in Mappable Data are the layers of data that appear in your rendered map whereas all the data listed in the Scenario Data includes all non-renderable data for the scenario (e.g. tables).
icon next to its name, to see the details of the scenario. Inside each scenario, you can see a list of the Mappable Data and Scenario Data. All data listed in Mappable Data are the layers of data that appear in your rendered map whereas all the data listed in the Scenario Data includes all non-renderable data for the scenario (e.g. tables).
The Scenario View is also where you would go to do the major operations on your scenarios: adding an earthquake hazard or other data, running damage analyses, etc.
Visualization View
The Visualization Window Views are where the rendered maps of your scenario will appear. Each scenario can have its own rendered 2d and 3d map, so you can see the visualization multiple scenarios simultaneously if desired. It is here that you can get a quick visual overview of the results of your analyses. You can control the camera position by using the mouse, or click the view control buttons in the toolbar.
Data Catalog View
The Catalog View is a list of all the data that is available for you to use in your scenarios. It is organized first by repositories, which are stores of MAEviz data. Repositories can represent local data, or data stored on a remote server. Within each repository, the data is organized by the type of data that it is. To add data to a scenario, you can navigate to and find the data within this view, then drag it into either the Visualization View for your scenario, or onto the scenario's name in the Scenario View. Before data can be made available to your scenario, it must be ingested into a repository and assigned a type. You can find instructions on ingesting building data here.
Style Editor View
The Style Editor is used to adjust the way in which a layer of data is displayed in the Visualization View. If the Style Editor is not visible, you can show it by right clicking a Mappable Data layer in the Scenario View, and selecting Change Layer Style. Once this view is showing, you can adjust the color, shape, opacity, and other display characteristics of the map layer. To apply your style changes, you must click the Apply button ( ) in the view's toolbar.