References
Tensorflow Official Benchmarks (May 2017, GitHub source): https://www.tensorflow.org/performance/benchmarks
IBM Power9 benchmark results (Nov 2017, 1.4.0): https://developer.ibm.com/linuxonpower/perfcol/perfcol-mldl/
Accurate, Large Minibatch SGD: Training ImageNet in 1 Hour, Facebook (Jun 2017): https://research.fb.com/wp-content/uploads/2017/06/imagenet1kin1h5.pdf
Benchmark Source Code
https://github-dev.cs.illinois.edu/kindrtnk/DL
System Statistics (more details in GitHub Repo)
* Instance type: IBM Power9 Hal000, 8335-GTG AC922 server
* CPU: 2x 20-core IBM POWER9 CPU @ 2.00GHz
* SDRAM: 512G DDR4
* GPU: 4x NVIDIA® Tesla® V100, 5120 cores, 16 GB HBM 2
* OS: Red Hat Enterprise Linux Server release 7.4
* Python Distribution: Anaconda python 3.6.2
* CUDA / cuDNN: 9.1/7.0.5
* TensorFLow Version: 1.5.0
* Disk: Local SSD
* DataSet: ImageNet (synthetic)
* Precision: floating point 32 and 16
* Test Date: Mar 25 2018POWER9 (hal000)
The following table is the result of running with the same configurations as the official Tensorflow benchmark mentioned in "Reference" section above:
This figure compares the result we get with Tensorflow official ones.
Green bars stand for our benchmark results using floating point 16.
Red bars are the official Tensorflow result.
Blue bars stand for our benchmark results using floating point 32.

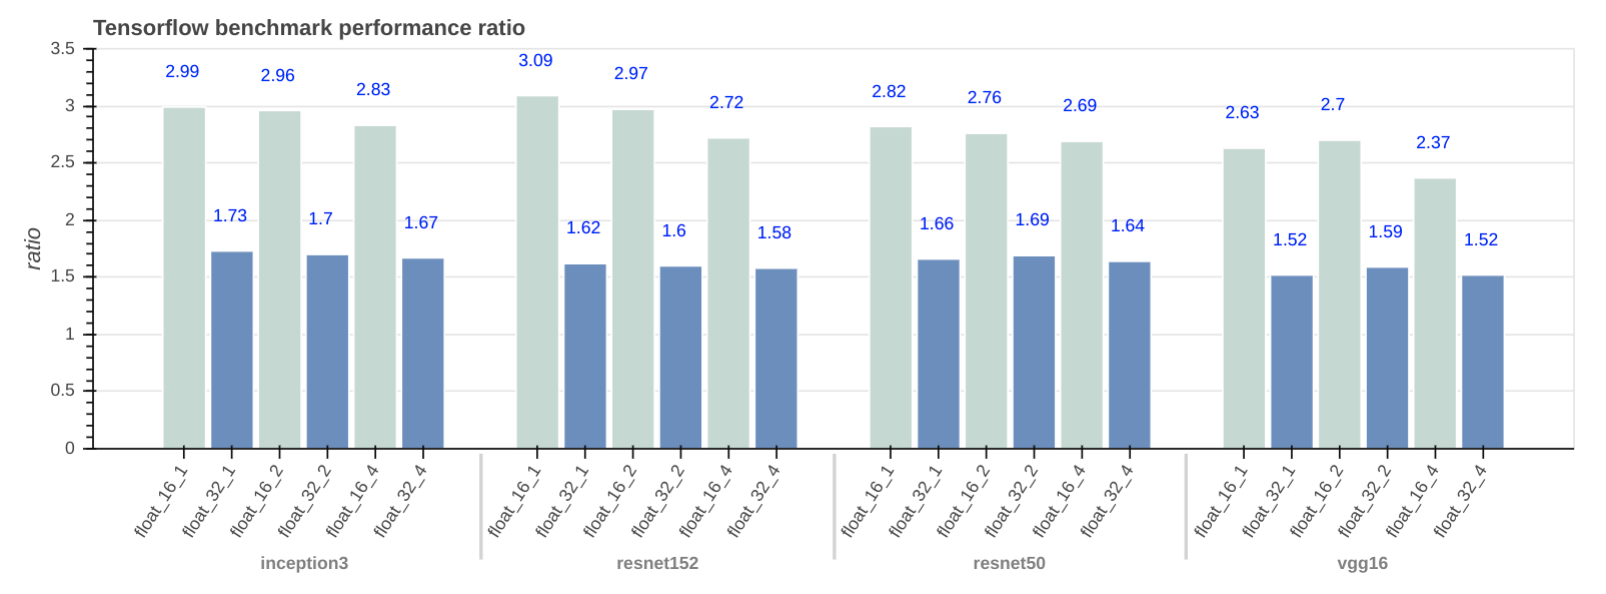
This figure shows the performance ratio of our floating point 16 and 32 benchmarks with respect to Tensorflow official results:
The following table provides a more comprehensive benchmark results on our system:
POWER8 (p8)