...
Now that we have a better understanding of the data format, we will go through the process of importing a buried pipeline into MAEviz. These steps will be just the generic steps since the file in the screenshots is only available in the Turkish version of MAEviz, but it will illustrate the process. If you are just going to use the MAEviz sample data, you can skip to the next section, View Pipeline Data.
- To import a pipeline dataset, launch MAEviz if you haven't already done so and go to File-> Import found in the top level menu. You should see a screen similar to the figure below.
...
- When MAEviz was initially installed, it created a repository called MAEviz Demo Data, which can be used to ingest the pipeline data into. Otherwise, choose a different repository or set one up through the MAEviz catalog view before ingesting the pipeline data. Click the Finish button when all fields have been entered.
View Pipeline Data
Example Scenario
From this point forward we will assume that you are using the sample dataset and will give instructions related to that scenario. In this example scenario, we are going to generate a fictitious earthquake in Shelby County, Tennessee and determine the pipeline damage for the region. If you have not already done so, then you will first need to launch MAEviz.
View Pipeline Data
- Next, create a scenario with Shelby County, Tennessee as your region of interest and choose the MAEviz 3.1.1 Analysis Defaults as your default set.
- Find the MAEviz Demo Data repository in the Data Catalog view and expand Lifeline -> Buried Pipeline Inventory -> Buried Pipline Sample Inventory. You should see something similar to the figure below.

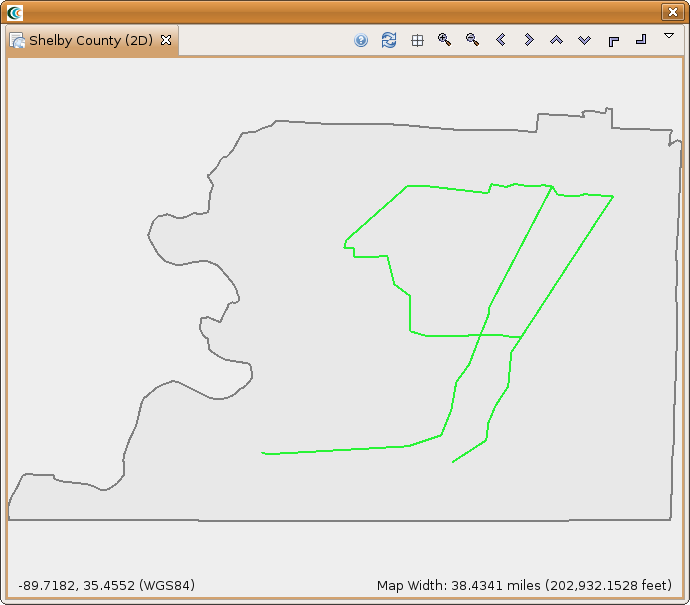
- Add the Buried Pipline Sample Inventory to your scenario and you should see something similar to the figure below.
Analysis
Next, let's look at running the Buried Pipeline Damage analysis. This analysis will compute the repair rate for each section of pipe based on the parameters set. To start, bring up the execute analysis window and select Lifeline -> Buried Pipeline Damage. You should see something similar to the figure below.

Most of the fields should be filled in by the default set. In our case we need to provide a Result Name, a Hazard, Fragilities and Fragility Mapping. For the Result Name we will use Shelby County Buried Pipeline Damage.
- For the Fragility field, search for and find the dataset Sample Buried Pipeline Fragility Set with Liquefaction.
- For the Fragility Mapping field, search for and find the dataset Sample Buried Pipe Fragility Mapping with Liquefaction.
- For the hazard, click the Create(
 ) button next to the Hazard field. This should add the Create Scenario Earthquake analysis to the graph. Click on Create Scenario Earthquake to bring up the form page.
 - Provide a Result Name, such as Memphis 7.0 Scenario EQ and set the magnitude to 7.0. For the Attenuation field, select CEUS Characteristic Event. You should have a form page similar to the one below.

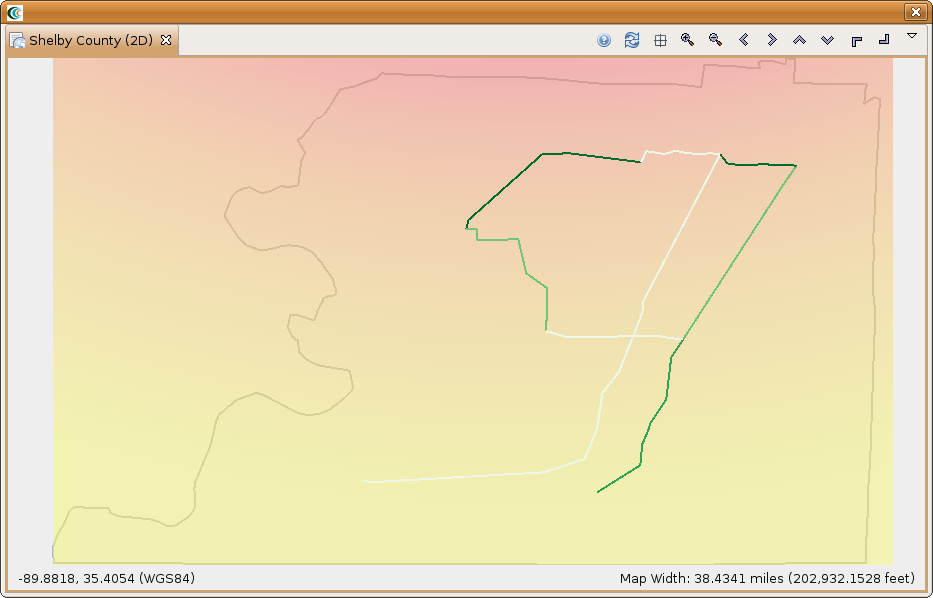
- After all of the required fields are filled in, click the Execute button. You should see a damage visualization similar to the one below.