...
Next, let's look at running the Buried Pipeline Damage analysis. This analysis will compute the repair rate for each section of pipe based on the parameters set. To start, bring up the execute analysis window and select Lifeline -> Buried Pipeline Damage. You should see something similar to Figure 10.the figure below.

Most of the fields should be filled in by the default set. In our case we need to provide a Result Name, a Hazard, Fragilities and Fragility Mapping. For the Result Name we will use Shelby County Buried Pipeline Damage.
- For the Fragility field, search for and find the dataset Sample Buried Pipeline Fragility Set with Liquefaction.
- For the Fragility Mapping field, search for and find the dataset Sample Buried Pipe Fragility Mapping with Liquefaction.
- For the hazard, click the Create(
 ) button next to the Hazard field. This should add the Create Scenario Earthquake analysis to the graph. Click on Create Scenario Earthquake to bring up the form page.
 - Provide a Result Name, such as Memphis 7.0 Scenario EQ and set the magnitude to 7.0. For the Attenuation field, select CEUS Characteristic Event. You should have a form page similar to the one below.

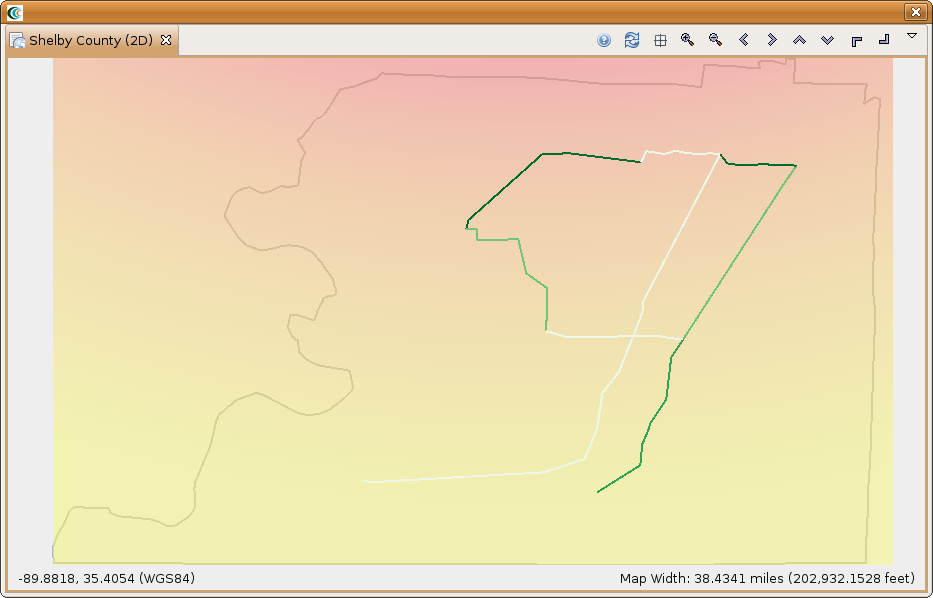
- After all of the required fields are filled in, click the Execute button. You should see a damage visualization similar to the one below.