...
- Now let's look at just those bridges along Interstate 26 (I-26). Right click the Bridge Damage layer, and select Filter. This brings up the Create Filter dialog box.
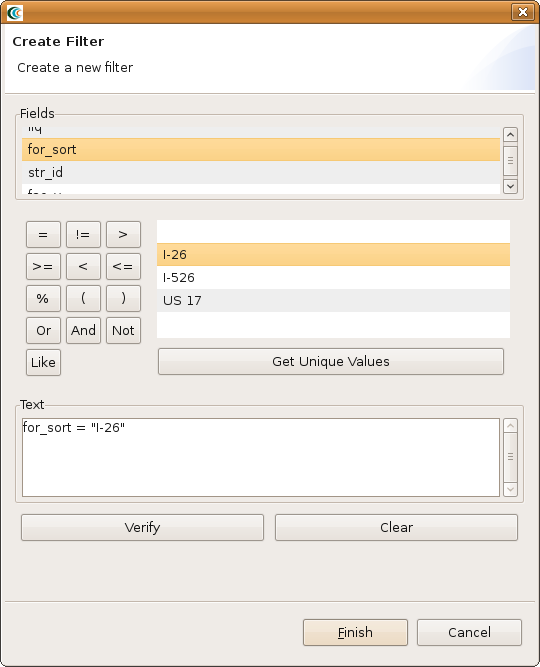
- In the Create Filter dialog, you must pick a field and value to filter by. Find and double-click FOR_SORT from the fields box at the top. This adds this field to the query at the bottom in the Text field. Click the = button to add an equal sign to the Text field because we want to find a particular value in the bridge damage dataset.
- Click the Get Unique Values button to see all possible values from that column in the building damage dataset. Find and double-click I-26. The dialog should look like the figure below.
- Press the Finish button. When it has finished filtering the dataset, you should see that many of the damage bars have been removed. This is because it is only displaying the damage bars for bridges along I-26.