...
- Next, let's add 3d damage bars to the bridges to make it easier to visualize damage across the entire map. Right click the Bridge Damage layer in the Scenario View, and choose Ranged 3D Visualization....
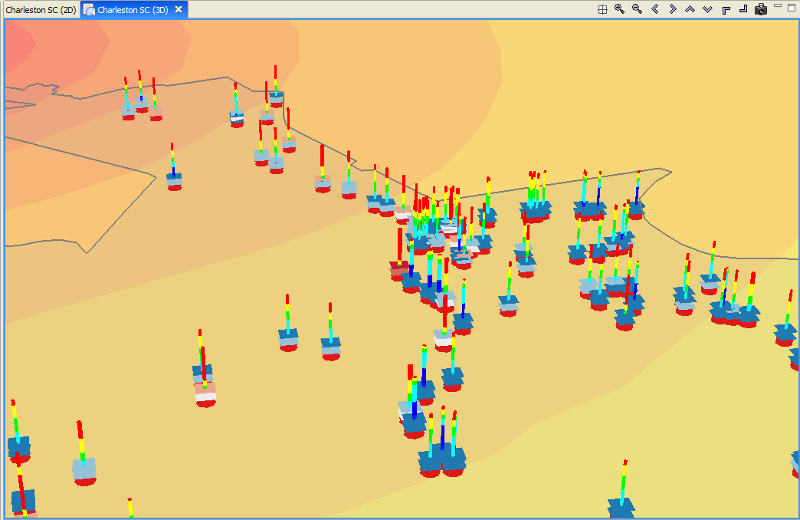
- Now we can choose which fields we want to display 3D damage bars for. For this example, we will want to see the chance of each damage state, so select none, slight-mod, mod-extens, ext-comple, and complete. Click Next. We will need to select some colors to distinguish between the damage states so you can either use the default or make some new selections. Click Finish and see the figure below.
Filtering Data
- Now let's look at just those bridges along Interstate 26 (I-26). Right click the Bridge Damage layer, and select Filter. This brings up the Create Filter dialog box.
- In the Create Filter dialog, you must pick a field and value to filter by. Find and double-click FOR_SORT from the fields box at the top. This adds this field to the query at the bottom in the Text field. Click the = button to add an equal sign to the Text field because we want to find a particular value in the bridge damage dataset.
- Click the Get Unique Values button to see all possible values from that column in the building damage dataset. Find and double-click I-26. The dialog should look like the figure below.