...
- First, we will view the results in a tabular grid, similar to an MS Excel spreadsheet. In the Scenario View, right click on the Bridge Damage layer, and select Show Attribute Table. The Table View should appear in the bottom right of the application window. Like other windows, you can move or resize it to make it easier to view.
- Now we will use the Table View to locate the bridges that suffered the most damage. Scroll to the right edge of the table view, and click the column header labeled expectval, which is the column for the expected damage value for the bridge. This will sort the table by the expected damage value.
- Now that we can see which bridges in the table have an expected value of Complete damage, let's locate those bridges in our map of the area. Make sure the Bridge Damage layer is still selected in the Scenario View, and make sure you are viewing the 2D Visualization View.
- Then, in the Table View, click on the first row with expected Value of Complete. You will one of the dots representing a bridge in the Visualization View change color to show that this is the selected bridge. The highlighted bridge will be colored light blue.
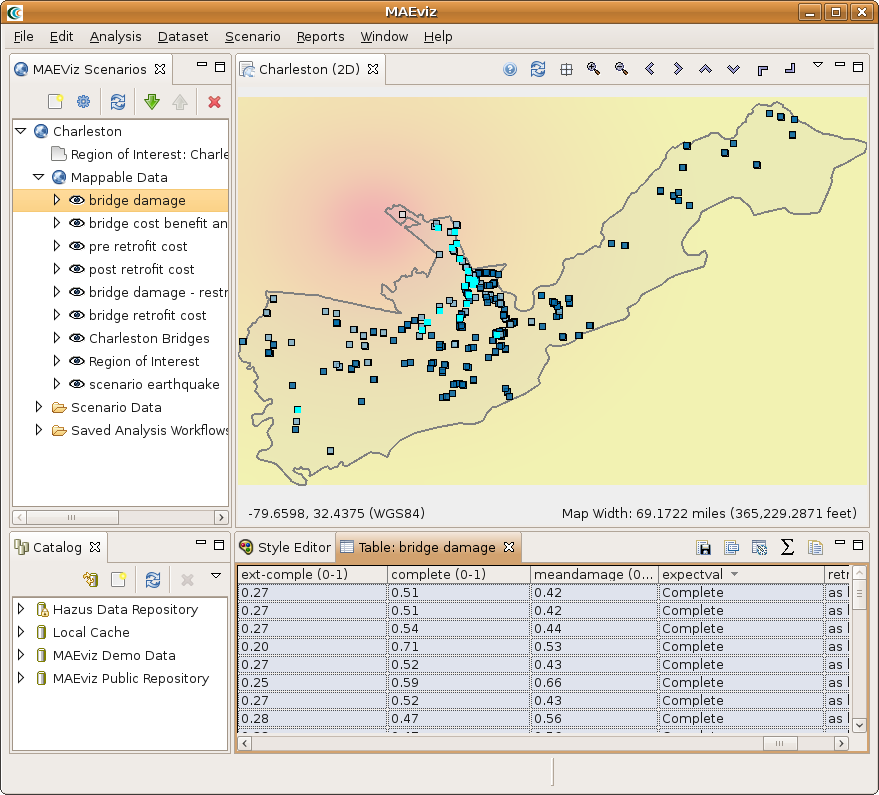
- Hold shift and click the last row with Complete as the expected value. This will select all the bridges in between. You will see these bridges highlighted light blue in the Visualization View. This way, you can see which bridges will likely suffer the most damage. See figure below.
3D Damage Bars
- Next, let's add 3d damage bars to the bridges to make it easier to visualize damage across the entire map. Right click the Bridge Damage layer in the Scenario View, and choose Ranged 3D Visualization....
- Now we can choose which fields we want to display 3D damage bars for. For this example, we will want to see the chance of each damage state, so select none, slight-mod, mod-extens, ext-comple, and complete. Click Next. We will need to select some colors to distinguish between the damage states so you can either use the default or make some new selections. Click Finish and see the figure below.