...
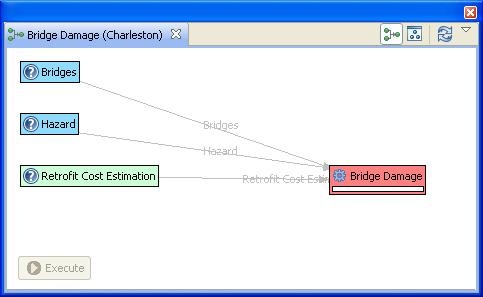
- The page that displays will show you a graphical view of the damage analysis, including all of its inputs and the current readiness of the analysis. See the figure below. If the graph does not look as well spaced as the one below, you can use the refresh button (
 ) to improve the graph view. It might also be necessary to enlarge the graph view if more space is required.
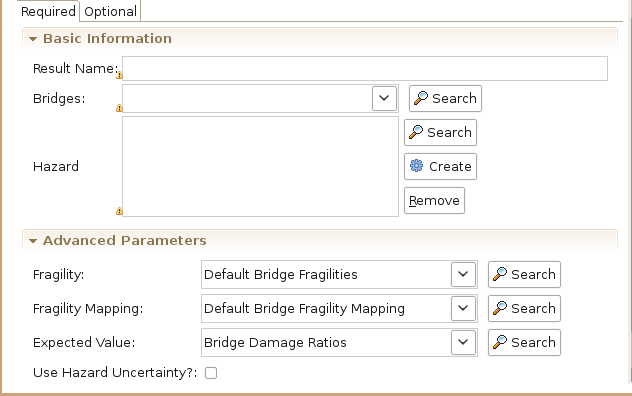
- The red background of Bridge Damage indicates that not all required inputs have been set. To begin, click once on the Bridge Damage box and an input form should appear below the analysis graph. See figure below. Under the required tab of the form, you will need to provide several inputs. Looking at the blank form, it tells you that no datasets containing Fragilities, Fragility Mapping, or Expected Value have been loaded into your scenario. To run this analysis, you must load datasets that contain these data. Also, select the bridges that we loaded from the Bridge dropdown menu and enter a name for the resulting dataset in the result name field.