...
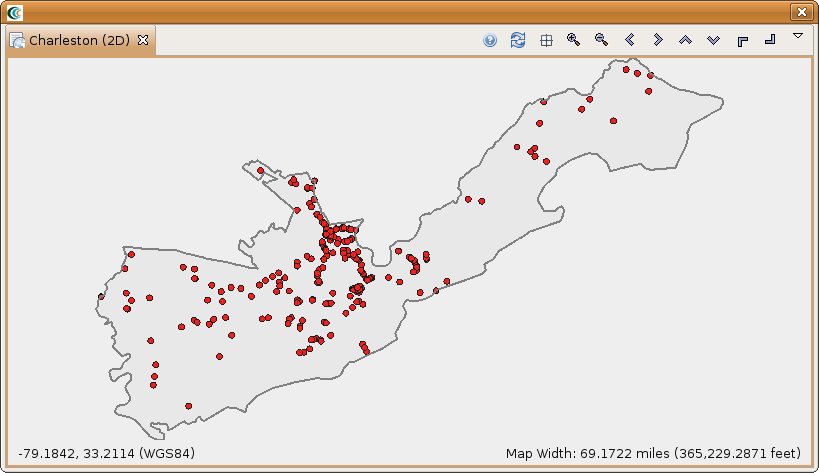
- At this point, bridges of the Charleston County should have been added to the Visualization View, and your Visualization View should look something like the figure below.
Some visualization controls:
- To zoom/pan/etc, use the controls at the top of the Visualization View.
- To view a 3d rendered view of the same information, right click the entry for your Scenario, and choose Render in 3D (VTK). This will bring up a second Visualization View that shows the same map, but from a 3d rendered perspective.
- After adjusting your view, if you want to restore to the original default view in the Visualization, click the Zoom to full extent button in the toolbar (
 )
)