...
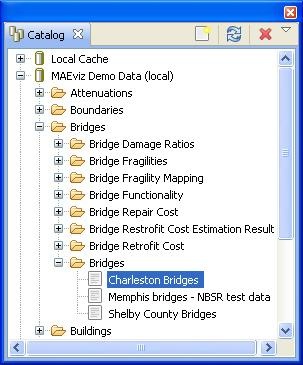
- First, we will add bridge data to the scenario. In the Catalog view (the lower-left view if your workbench is arranged in the default setting, as shown in the figure below), expand the MAEviz Demo Data item, then Bridges, Bridges, then select the bridge dataset for our study area, Charleston Bridges. Click and drag the Bridge datasets into the Visualization View. Alternatively, you can right-click the item and select Load Dataset.
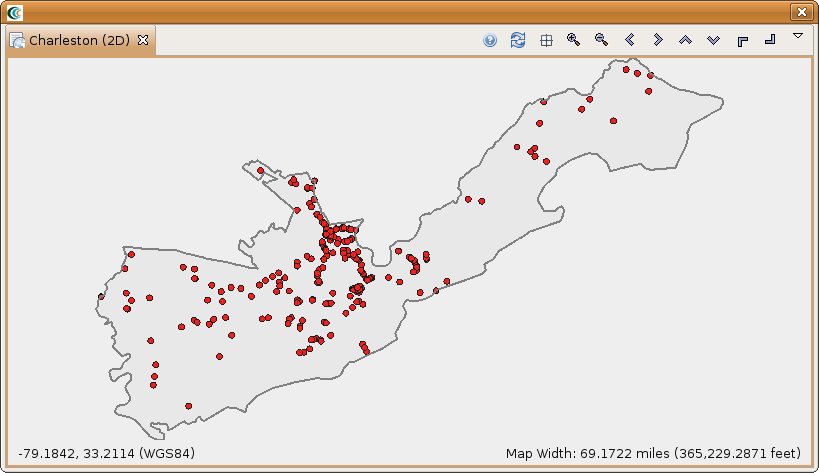
- At this point, bridges of the Charleston County should have been added to the Visualization View, and your Visualization View should look something like the figure below.