...
The Scenario View is where you will find a list of all the data for the scenario or scenarios that you are currently working with. Each scenario that you are working with is listed as a top-level item in this view, which can be expanded by clicking the plus (+) ![]() icon next to its name, to see the details of the scenario. Inside each scenario, you can see a list of the Mappable Data and Scenario Data. All data listed in Mappable Data are the layers of data that appear in your rendered map whereas all the data listed in the Scenario Data includes all non-renderable data for the scenario (e.g. tables).
icon next to its name, to see the details of the scenario. Inside each scenario, you can see a list of the Mappable Data and Scenario Data. All data listed in Mappable Data are the layers of data that appear in your rendered map whereas all the data listed in the Scenario Data includes all non-renderable data for the scenario (e.g. tables).
...
- When you start MAEviz and if this is the first time you have run MAEviz, you will be shown the welcome screen. To begin working with MAEviz, click the rightmost icon (
 ) which will take you directly to the MAEviz workbench.
 - From the application's menu bar, click File -> New Scenario. Alternatively, you can click the New Scenario button (
 ) from the Scenario View's tool bar
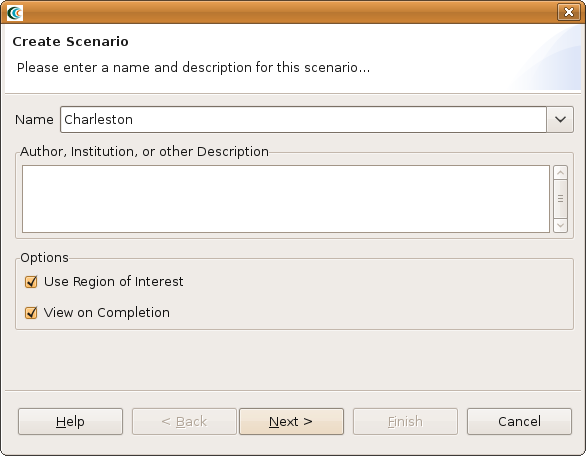
 - The New Scenario Wizard will now be showing. This is where you define the scenario that you would like to work with. Enter a name for your scenario, such as "Charleston", and then optionally enter any descriptive information about the scenario in the large text box. Click the Next button. See the figure below.
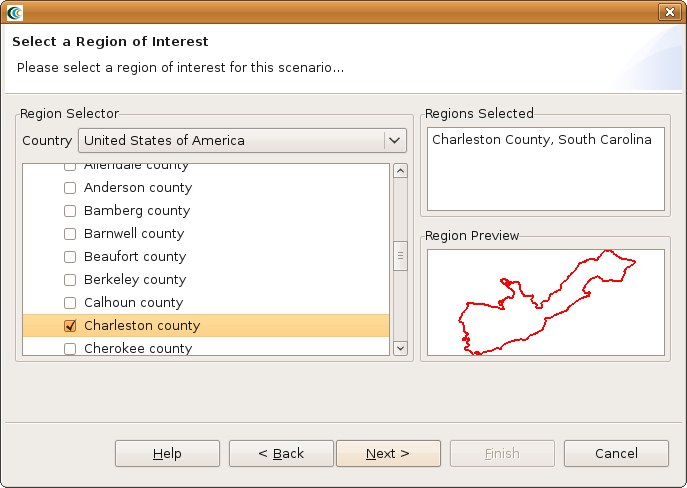
- At this point, you will be selecting the region of interest that you would like to work with. We will be analyzing Charleston, SC, so select United States of America from the Country menu. You should see a list of states appear in alphabetical order. Scroll down to find the state of Tennessee and click the (+)
 symbol next to South Carolina. You will now see a list of counties displayed. Scroll down to find Charleston and click the box so that a check appears next to the name. You should now see Charleston, South Carolina populate the Regions Selected box. This new region of interest wizard allows you to add multiple regions of interest by checking other boxes of regions you want to use; however, for this tutorial we will only focus on Charleston (See figure below). Click Next when finished.
- The next screen allows you to select a default set. This will populate the analysis user interface pages with default data where applicable (e.g. default fragilities, default fragility mapping, etc). From the dropdown menu, select "South Carolina Defaults". Note: For completeness, this tutorial will assume that no default set has been chosen so you might find some fields that you are requested to fill in already filled in for you. In these cases, you can ignore the tutorial instructions. Click Finish to complete the wizard and have MAEviz initialize your new scenario