...
- MAEviz also provides the ability to aggregate data to a geographic boundary, such as the census-tract level. To do this, first add census tract boundary data to your scenario by going to the Catalog view and expanding MAEviz Demo Data -> Boundaries -> Census Tracts, then dragging Shelby County Census Tracts into your Visualization View.
- Now, we want to do an aggregation analysis. Use the Analysis button (
 ) again to start the analysis wizard. This time, choose GIS -> Aggregate features to region
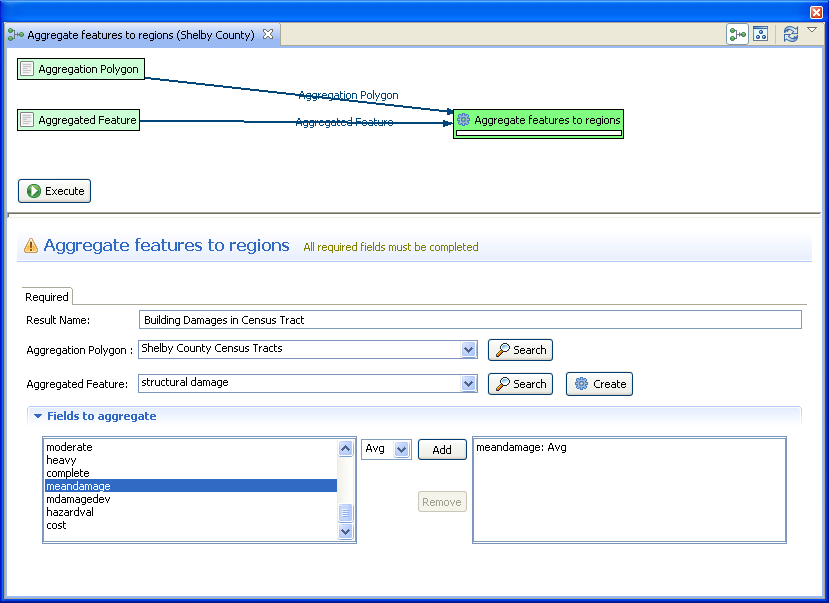
 - For the Aggregation Polygon field, choose Shelby County Census Tracts. This indicates that you want to aggregate results by the polygon boundaries in the census tract dataset.
- For the Aggregated Feature field, choose your Building Damage dataset. This is where you select which layer contains the data that you want to aggregate over the census tracts.
- For the Result Name field, provide a descriptive name such as Building Damage by Census Tract.
- Last, in the Fields to aggregate section, select the mean damage field in the left text box, select Avg from the drop down menu and click the Add button. You should have something similar to the figure below. Once you are finished adding fields, click the Execute button.