...
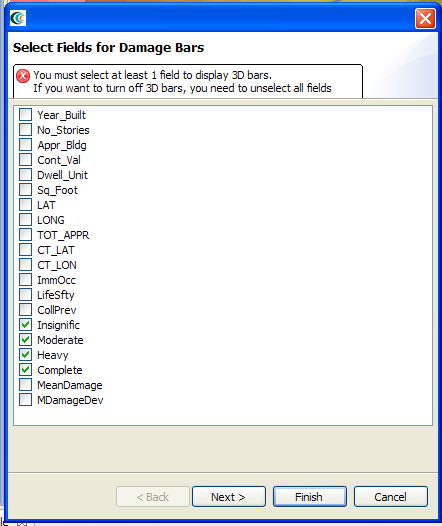
- Now we can choose which fields we want to display 3d damage bars for. For this example, we will want to see the chance of each damage state, so select Insignific, Moderate, Heavy, and Complete. See figure below
- Click Next. On the next screen, you can choose colors for the various fields. Choose a reasonable set of colors, or use the defaults, then press the Finish button.
- Bring the 3d Visualization View back to the front, and you will see that damage bars have been added for each building. Zoom in and you can quickly see the probable damage states for each building based on the bars. The size of each color in the bar represents the likelihood that the building will be in that damage state. See figure below. Your visualization may differ depending on the fragilities used, whether uncertainty was included in the damage analysis and which hazard was used. In the example below, the Insignific is represented by dark blue, Moderate is represented by light blue, Heavy is represented by green/yellow, and Complete is represented by red.
