...
- Now that we have the economic losses for the buildings, we can determine the fiscal impact of the economic loss. To do this, click the Execute Analysis button (
 ) again and select the Fiscal Impact Analysis under the Socioeconomic category and click Finish. The new window shows the parameters for computing the fiscal impact (see figure below). The tax rate field is the default property tax rate to use for the region if no property tax map is provided. One optional field is to use a tax map; however, if one is available it will first need to be added to MAEviz by ingesting it. For this tutorial, we will ignore this field. Another optional field, Select Minimum DED, allows you to enter the minimum economic loss criteria used to select the buildings for inclusion in the property tax loss calculation. For example, entering 10.0 will only calculate the property tax loss for buildings that lost more than 10% of their value from direct economic damage. Those with less will be given the value 0 for property tax loss. Entering 0 for the field will include all buildings in the calculation, regardless of the amount of building value loss. For this analysis, we will include all buildings, which is the default operation. Click finish to generate the fiscal impact.

Decision Support
Analyzing Results
Now that the analyses that we were interested in have been completed, it's time to analyze and try to make sense of the results. There are various ways of viewing and visualizing the results, which we will learn now.
Table View Results
- First, we will view the results in a tabular grid, similar to an MS Excel spreadsheet. In the Scenario View, right click on the structural damage layer, and select Show Attribute Table. The Table View should appear in the bottom right of the application window. Like other windows, you can move or resize it to make it easier to view.
- Now we will use the Table View to locate the buildings that suffered the most damage. Scroll to the right edge of the table view, and click the column header labeled MeanDamage, which is the column containing the mean damage value for each building. This will sort the table by the mean damage value.
- Now that we can see which buildings in the table have the highest values of mean damage, let's locate those buildings in our map of the area. Make sure the Building Damage layer is still selected in the Scenario View, and make sure you are viewing the 2D Visualization View.
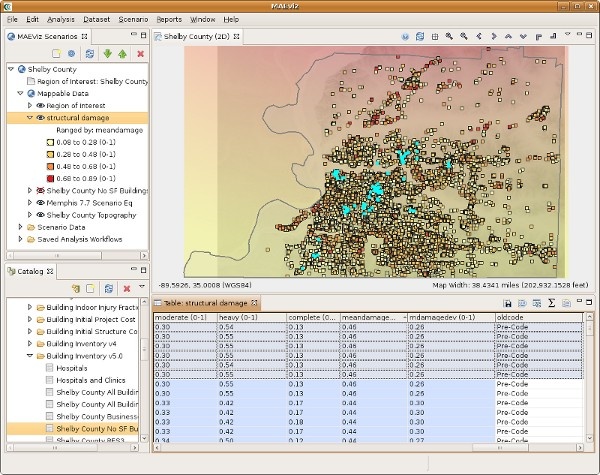
- Then, in the Table View, click on the first row with mean damage Value of highest. You will see one of the dots representing a building in the Visualization View change color to show that this is the selected building.
- Hold shift and click the last row with desired mean damage value. This will select all the buildings in between. You will see these buildings all change color in the Visualization View. This way, you can see which buildings will suffer the most damage. See figure below.