...
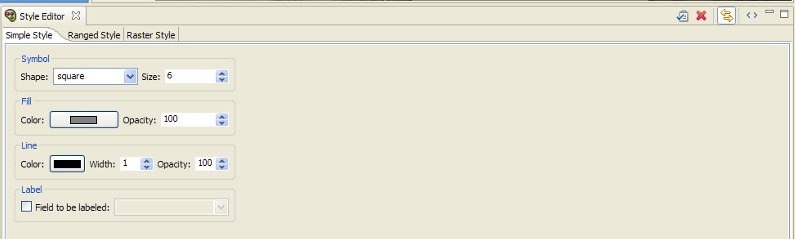
In the Style Editor (see figure below), the Simple Style tab should be active. Click the black box labeled Color, and select a color that is easier to see, such as yellow. Click Ok in the color selection box and then to apply the style change, click the Apply Style button in the Style Editor's tab bar. (  )
)
Some visualization controls:
- To zoom/pan/etc, use the controls at the top of the Visualization View. Use these to adjust your view.
- To view a 3d rendered view of the same information, right click the entry for your Scenario, and choose Render in 3D (VTK). This will bring up a second Visualization View that shows the same map, but from a 3d rendered perspective.
- After adjusting your view, if you want to restore to the original default view in the Visualization, click the Zoom to full extent button in the toolbar (
 )
)
Running an Analysis
Now that we have a basic map to look at, we will learn how to run an analysis. Analyses in MAEviz consist of any sort of calculation that generates data. For example, generating a deterministic earthquake map based on a magnitude and epicenter would be considered one type of analysis. Using that earthquake map as well as building inventory data to generate information about building damage would be another type of analysis.
In this example, we want to find building damage results based on a deterministic earthquake hazard that we will specify.
- First, we will launch the Run Analysis Wizard. To do so, you can click the Execute Analysis toolbar button (
 ).
).