...
This time, notice valgrind has marked a line of the code with a malloc(). Since there's no corresponding free for that memory, valgrind throws an error. 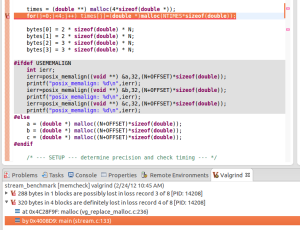
Switching to Valgrind's Massif tool, we can profile the memory use of the application over time for heap (default) and stack (if selected in the options). Also note that clicking on one of the data points in the massif plot will highlight that snapshot in the Valgrind table tab.
The cachegrind tool can simulate how your application interacts with cache . A profile run with cachegrind will generate data for all of your application and the system calls required to support it. You'll typically find your application code's profile data toward the end of the list. Hover over the Location labels for detail on their meaning. Selecting a file->routine->line# in the Valgrind Cachegrind table will take you to that line in your source code.
References: