NCSA wiki will be offline Friday, Apr 19, 2024, from 1700 hours until Sun, Apr 21, 2024 in order to upgrade Confluence.
| Table of Contents |
|---|
Motivation
A couple basic tools are included with most linux distributions providing code coverage analysis and function profiling: gcov and gprof. Using just these 2 tools, it's easy to gain understanding of how your code is running. With the linuxtools Eclipse incubation project ( http://www.eclipse.org/linuxtools/ , now bundled with PTP ) , gprof and gcov are fully integrated into the cdt editor perspective. Let's see how the linuxtools project adds value and puts a fresh look on these classic linux code analysis tools.
...
To use gprof and gcov, add the appropriate flags to the Makefile. I'll run a single test job to get both profile and coverage data at once by using -pg for gprof and "-ftest-coverage -fprofile-arcs" for gcov (-g is included so that we have source code line numbering available). Do a project .> refresh and note the additional files created for use by gcov after compiling with "-ftest-coverage -fprofile-arcs". 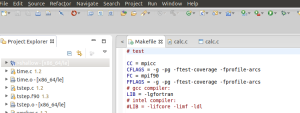

Setup the MPI run configuration with the Environment variable GMON_OUT_PREFIX defined with a name for your individual MPI rank gmon outputs. By default gmon.out is used but MPI doesn't do that well and you end up with a profile that's missing most of the information, so by using GMON_OUT_PREFIX, each MPI rank adds its process id to its gmon output filename.
...
| Code Block |
|---|
galen@lgheron:~/workspace/shallow$ gprof -s shallow gmon_* galen@lgheron:~/workspace/shallow$ ls calc.c decs.h eclipse.inc init.o time.c worker.c calc.gcda diag.c gmon_shallow.9885 main.c time.gcda worker.gcda calc.gcno diag.gcda gmon_shallow.9886 main.gcda time.gcno worker.gcno calc.o diag.gcno gmon_shallow.9887 main.gcno time.o worker.o copy.c diag.o gmon_shallow.9888 main.o tstep.c copy.gcda dump.c gmon.sum Makefile tstep.f90 copy.gcno dump.gcda init.c Makefile.gem tstep.gcda copy.o dump.gcno init.gcda Makefile.mk tstep.gcno CVS dump.o init.gcno shallow tstep.o galen@lgheron:~/workspace/shallow$ |
![]()

![]()
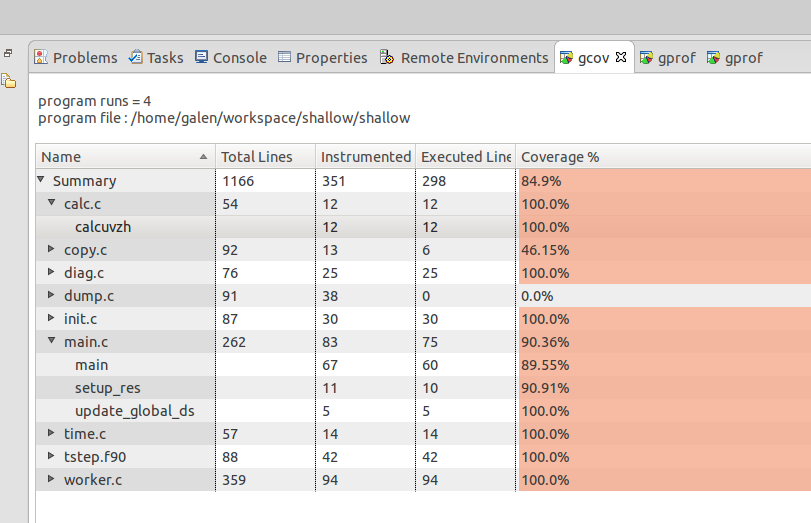
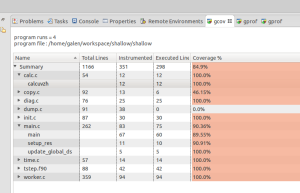
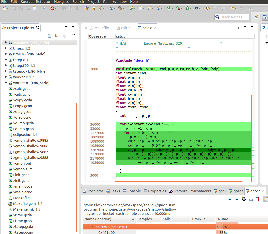
The gcov view is simlar to the gprof view but keep in mind that you're looking at code coverage and not necessarily performance or timing information (though there is a relationship...code not executed is performing quite well ! ). Also note that multiple executions will accumulate values in the gcov output files until they are removed or truncated to zero-length (2nd run to demonstrate this).
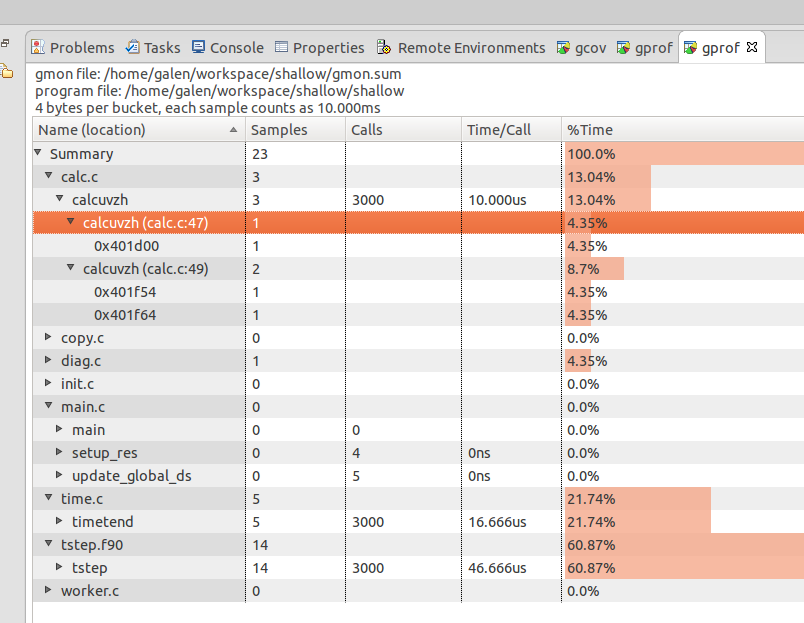
Selecting (double click) a source code line from either the gcov or gprof view and you'll see the file and routine highlighted in the cdt c/c++ perspective. Also notice the support for the .f90 file and its routines. 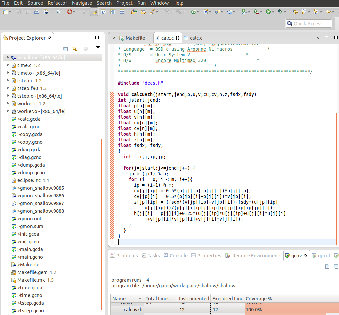


References:
http://wiki.eclipse.org/Linux_Tools_Project/GProf/User_Guide
...