...
- Now let's just look at those buildings that are flagged as being Low-rise Hospitals. Right click the Building Damage layer, and select Filter.
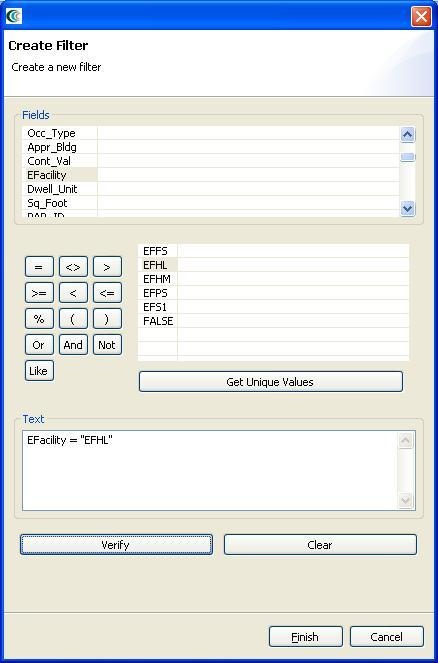
- This brings up the filters dialog. In the Create a Filter dialog, you must pick a field and value to filter by. Choose efacility to filter by building essential facility by double clicking on it. This adds the field to the query at the bottom of the page. Next, click the equal (=) sign button. Finally, to find all of the unique values for the field we selected (efacility), click the Get Unique Values button. Double click on the value EFHL, which is the hospital essential facility attribute. The dialog should look like the figure below.
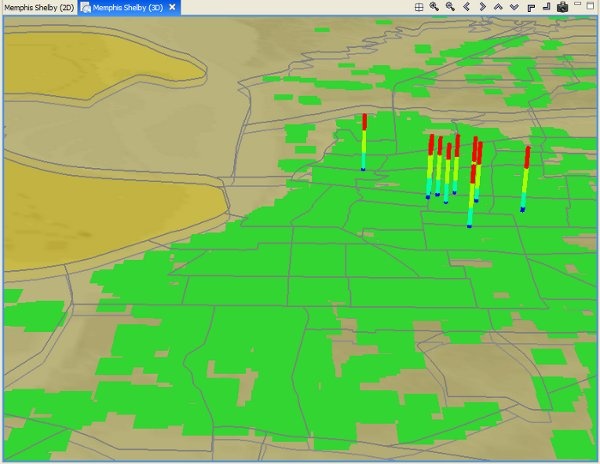
- Press )Finish_. When MAEviz is finished, you should see that many of the damage bars have been removed, if you still have the 3d visualization up. Otherwise, in the 2D view, you will notice most of the objects representing buildings have been removed. This is because the view is only displaying the buildings with the essential facility attribute EFHL.
Reporting
The last visualization we want to take a look at is generating reports for each dataset in MAEviz. This operation is supported by the metadata that is specified for each dataset and result type so that MAEviz can generate basic reports that contain the information that is important to the user without any customization required. For those users who have more specific needs, the reports can be customized. Metadata is defined for each result type that specify important result data including what should be graphed, what type of aggregation should be used to summarize the data, etc. In the next steps, we will demonstrate how a user will generate a report for the building damage.
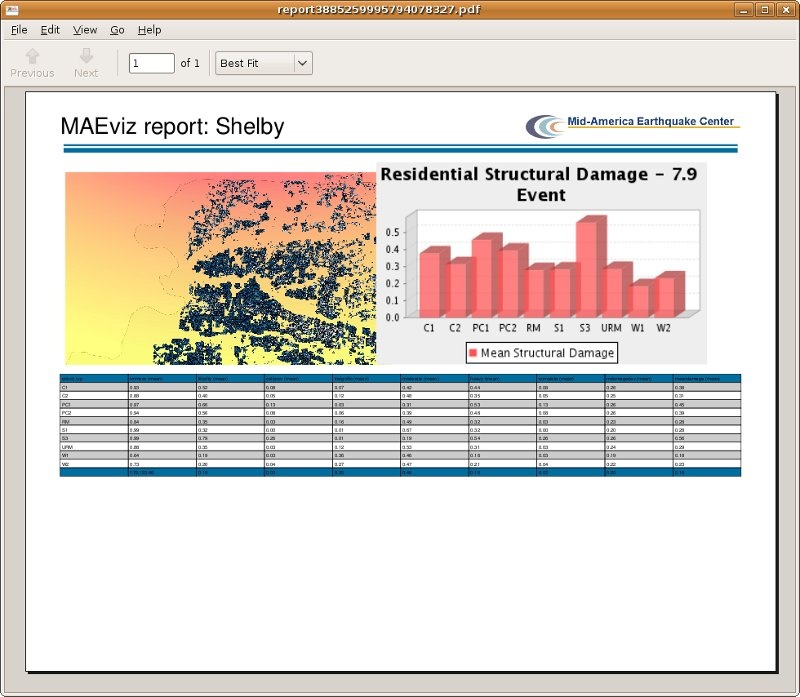
- To generate a printable report for the building damage result, right click on the dataset name in the Scenario View, and select Reports.... This will open the Select Report View. This gives us a list of reports that MAEviz can generate. The two default ones listed are the Default Detail Report and Default Summary Report. The detail report provides a detailed report on a building by building basis (for building damage, or bridge by bridge for bridge damage, etc). The summary report provides a summary of the results categorized by the attribute specified as the summary variable. For example, in the case of building damage, the damage is summarized by building type. For bridges, it is summarized by bridge type.
- To run the Building Damage summary report, right click on Default Summary Report and select Run Report. From the dialog box that comes up, select the building damage dataset and click Finish. The Report View will appear when the report is finished by generated. See figure below.
- You can print this report by going to File -> Print.
- To save the report, go to File -> Save a copy
Conclusion
Based on this simple building damage analysis, we can conclude that the MAEviz tool helps to identify areas of high risk. Using the decision support tools for buildings in MAEviz, we looked at some mitigation options that may be beneficial to consider. The only additional requirement would be that the decision maker define their risk tolerance in utility functions for MAEviz to use in order to recommend mitigation options. From the analyses performed, the Emergency Manager in our example is able to take the information and results from this analysis and evaluate detailed options for specific buildings base on proprietary information in the department's databases and files. Furthermore, probabilistic scenarios can also be evaluated in addition to a deterministic earthquake such as the one we used in this example. The analysis could also be expanded to look at other components in the region such as the utility networks, schools (since these typically serve as temporary shelters), hospitals, police stations, etc. Some of these data are available with the default installation of MAEviz and is left as an exercise to the user.
The MAEviz tool provides an environment for visual exploration, analysis and evaluation of engineering options pertinent to investigating bridge and building retrofit options. These results for bridges and buildings can be fed into the traffic models and the decision support models to aid in selecting retrofit options, emergency routing, and pre/post mitigation planning. Furthermore, the MAEviz Cyberenvironment enables MAEviz users to more effectively collaborate and share results.
Please contact the Mid-America Earthquake Center for further information on MAEviz.
Mid-America Earthquake Center
205 N. Mathews Avenue
1240 Newmark Lab
Urbana, IL 61801
Tel: (217) 244-6302 Fax: (217) 333-3821